Prometheus安装与配置

文章目录
一、实验环境准备:
两台CentOS 7 Server,一台作为Prometheus Server,另一台作为Prometheus Target。
配置好网卡,IP地址分别为:10.x.x.117 (Server)/ 10.x.x.111(Target).
Prometheus架构如下:图片来源
二、下载最新版本的prometheus包
su - prometheus
cd /home/prometheus/
wget https://github.com/prometheus/prometheus/releases/download/v2.18.1/prometheus-2.18.1.darwin-amd64.tar.gz
解压并更改目录名
tar xvfz prometheus-*.tar.gz
mv prometheus-*/ prometheus/
新建'data'目录用于存放'tsdb' storage.
cd prometheus
mkdir -p data
三、切换到root用户,将prometheus配置为系统service
新建prometheus.service文件
cd /etc/systemd/system/
vim prometheus.service
复制以下内容到prometheus.service文件
[Unit]
Description=Prometheus Server
Documentation=https://prometheus.io/docs/introduction/overview/
After=network-online.target

[Service]
User=prometheus
Restart=on-failure

#Change this line if you download the
#Prometheus on different path user
ExecStart=/home/prometheus/prometheus/prometheus \
  --config.file=/home/prometheus/prometheus/prometheus.yml \
  --storage.tsdb.path=/home/prometheus/prometheus/data

[Install]
WantedBy=multi-user.target
保存并退出, 重新加载systemctl daemon,启动系统服务,设为开机启动
systemctl daemon-reload
systemctl start prometheus
systemctl enable prometheus
查看prometheus运行状态,运行成功状态如下:
systemctl status prometheus[root@localhost prometheus]# systemctl status prometheus
● prometheus.service - Prometheus Server
Loaded: loaded (/etc/systemd/system/prometheus.service; enabled; vendor preset: disabled)
Active: active (running) since Tue 2020-05-19 20:18:20 EDT; 22h ago
Docs: https://prometheus.io/docs/introduction/overview/
Main PID: 19643 (prometheus)
Tasks: 11
Memory: 120.0M
CGroup: /system.slice/prometheus.service
└─19643 /home/prometheus/prometheus/prometheus --config.file=/home/prometheus/prometheus/prometheus.yml --storage.tsdb.path=/home/prometheus/prometheus/data
May 20 13:00:00 localhost.localdomain prometheus[19643]: level=info ts=2020-05-20T17:00:00.508Z caller=head.go:668 component=tsdb msg="WAL checkpoint complete" first=30 last...03.10829ms
May 20 15:00:00 localhost.localdomain prometheus[19643]: level=info ts=2020-05-20T19:00:00.398Z caller=compact.go:496 component=tsdb msg="write block" mint=1589990400000 max...1.194679ms
May 20 15:00:00 localhost.localdomain prometheus[19643]: level=info ts=2020-05-20T19:00:00.411Z caller=head.go:598 component=tsdb msg="head GC completed" duration=2.444659ms
May 20 17:00:00 localhost.localdomain prometheus[19643]: level=info ts=2020-05-20T21:00:00.398Z caller=compact.go:496 component=tsdb msg="write block" mint=1589997600000 max...1.750735ms
May 20 17:00:00 localhost.localdomain prometheus[19643]: level=info ts=2020-05-20T21:00:00.411Z caller=head.go:598 component=tsdb msg="head GC completed" duration=2.852627ms
May 20 17:00:00 localhost.localdomain prometheus[19643]: level=info ts=2020-05-20T21:00:00.517Z caller=head.go:668 component=tsdb msg="WAL checkpoint complete" first=32 last...6.413925ms
May 20 17:00:00 localhost.localdomain prometheus[19643]: level=info ts=2020-05-20T21:00:00.588Z caller=compact.go:441 component=tsdb msg="compact blocks" count=3 mint=158997...0.858332ms
May 20 17:00:00 localhost.localdomain prometheus[19643]: level=info ts=2020-05-20T21:00:00.710Z caller=compact.go:441 component=tsdb msg="compact blocks" count=3 mint=158993...2.481186ms
May 20 19:00:00 localhost.localdomain prometheus[19643]: level=info ts=2020-05-20T23:00:00.390Z caller=compact.go:496 component=tsdb msg="write block" mint=1590004800000 max...7.127263ms
May 20 19:00:00 localhost.localdomain prometheus[19643]: level=info ts=2020-05-20T23:00:00.402Z caller=head.go:598 component=tsdb msg="head GC completed" duration=2.376046ms
Hint: Some lines were ellipsized, use -l to show in full.打开浏览器,输入网址:[server_ip]:9090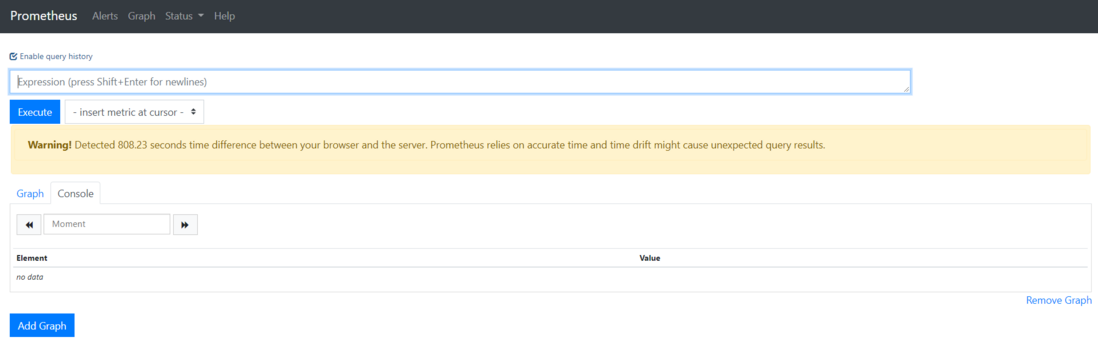
在expression搜索框输入prometheus_http_requests_total,点EXECUTE按钮,在下方的Graph中可看到prometheus的http requests的图表。
四、下载配置node_exporter
prometheus通过pull向各个node抓取信息,需要在各个node上安装exporter。
我们先在server本机安装一个exporter用来监控server本身。
su - prometheus
cd /home/prometheus
wget https://github.com/prometheus/node_exporter/releases/download/v0.18.1/node_exporter-0.18.1.linux-amd64.tar.gz
解压更改名字
tar -xf node_exporter-0.18.1.linux-amd64.tar.gz
mv node_exporter-0.18.1.linux-amd64 node_exporter
一样的我们来创建node_exporter.service
cd /etc/systemd/system/
vim node_exporter.service
复制以下内容到node_exporter.service
[Unit]
Description=Node Exporter
Wants=network-online.target
After=network-online.target

[Service]
User=prometheus
ExecStart=/home/prometheus/node_exporter/node_exporter

[Install]
WantedBy=default.target
保存并退出,重新加载,启动service
systemctl daemon-reload
systemctl start node_exporter
systemctl enable node_exporter
查看node_exporter运行状态,可以看到node_exporter listen 9100端口,prometheus server listen 9090端口
systemctl status node_exporter
netstat -plntu
[root@localhost ~]# systemctl status node_exporter
● node_exporter.service - Node Exporter
Loaded: loaded (/etc/systemd/system/node_exporter.service; enabled; vendor preset: disabled)
Active: active (running) since Tue 2020-05-19 20:00:48 EDT; 23h ago
Main PID: 19135 (node_exporter)
Tasks: 8
Memory: 8.0K
CGroup: /system.slice/node_exporter.service
└─19135 /home/prometheus/node_exporter/node_exporter
May 19 20:00:48 localhost.localdomain node_exporter[19135]: time="2020-05-19T20:00:48-04:00" level=info msg=" - sockstat" source="node_exporter.go:104"
May 19 20:00:48 localhost.localdomain node_exporter[19135]: time="2020-05-19T20:00:48-04:00" level=info msg=" - stat" source="node_exporter.go:104"
May 19 20:00:48 localhost.localdomain node_exporter[19135]: time="2020-05-19T20:00:48-04:00" level=info msg=" - textfile" source="node_exporter.go:104"
May 19 20:00:48 localhost.localdomain node_exporter[19135]: time="2020-05-19T20:00:48-04:00" level=info msg=" - time" source="node_exporter.go:104"
May 19 20:00:48 localhost.localdomain node_exporter[19135]: time="2020-05-19T20:00:48-04:00" level=info msg=" - timex" source="node_exporter.go:104"
May 19 20:00:48 localhost.localdomain node_exporter[19135]: time="2020-05-19T20:00:48-04:00" level=info msg=" - uname" source="node_exporter.go:104"
May 19 20:00:48 localhost.localdomain node_exporter[19135]: time="2020-05-19T20:00:48-04:00" level=info msg=" - vmstat" source="node_exporter.go:104"
May 19 20:00:48 localhost.localdomain node_exporter[19135]: time="2020-05-19T20:00:48-04:00" level=info msg=" - xfs" source="node_exporter.go:104"
May 19 20:00:48 localhost.localdomain node_exporter[19135]: time="2020-05-19T20:00:48-04:00" level=info msg=" - zfs" source="node_exporter.go:104"
May 19 20:00:48 localhost.localdomain node_exporter[19135]: time="2020-05-19T20:00:48-04:00" level=info msg="Listening on :9100" source="node_exporter.go:170"
[root@localhost ~]# netstat -plntu
Active Internet connections (only servers)
Proto Recv-Q Send-Q Local Address Foreign Address State PID/Program name
tcp 0 0 127.0.0.1:25 0.0.0.0:* LISTEN 1694/master
tcp 0 0 0.0.0.0:445 0.0.0.0:* LISTEN 1425/smbd
tcp 0 0 0.0.0.0:10050 0.0.0.0:* LISTEN 10918/zabbix_agentd
tcp 0 0 0.0.0.0:139 0.0.0.0:* LISTEN 1425/smbd
tcp 0 0 0.0.0.0:22 0.0.0.0:* LISTEN 1351/sshd
tcp6 0 0 ::1:25 :::* LISTEN 1694/master
tcp6 0 0 :::445 :::* LISTEN 1425/smbd
tcp6 0 0 :::9090 :::* LISTEN 19643/prometheus
tcp6 0 0 :::10050 :::* LISTEN 10918/zabbix_agentd
tcp6 0 0 :::139 :::* LISTEN 1425/smbd
tcp6 0 0 :::9100 :::* LISTEN 19135/node_exporter
tcp6 0 0 :::22 :::* LISTEN 1351/sshd
tcp6 0 0 :::3000 :::* LISTEN 20400/docker-proxy
udp 0 0 172.17.255.255:137 0.0.0.0:* 1357/nmbd
udp 0 0 172.17.0.1:137 0.0.0.0:* 1357/nmbd
udp 0 0 10.37.2.255:137 0.0.0.0:* 1357/nmbd
udp 0 0 10.37.2.117:137 0.0.0.0:* 1357/nmbd
udp 0 0 0.0.0.0:137 0.0.0.0:* 1357/nmbd
udp 0 0 172.17.255.255:138 0.0.0.0:* 1357/nmbd
udp 0 0 172.17.0.1:138 0.0.0.0:* 1357/nmbd
udp 0 0 10.37.2.255:138 0.0.0.0:* 1357/nmbd
udp 0 0 10.37.2.117:138 0.0.0.0:* 1357/nmbd
udp 0 0 0.0.0.0:138 0.0.0.0:* 1357/nmbdnode_exporter 启动之后,我们访问下 /metrics 接口看看是否能正常获取服务器指标:
curl http://localhost:9100/metrics我们可以修改 Prometheus 的配置文件,将server ip加到 scrape_configs 中:
vi /home/prometheus/prometheus/prometheus.ymlscrape\_configs:
- job\_name: 'prometheus'
static\_configs:
- targets: \['10.x.x.117:9090'\]
- job\_name: 'server'
static\_configs:
- targets: \['10.x.x.117:9100'\]保存并退出,重启prometheus服务
systemctl restart prometheus我们实验一下让prometheus server抓取exporter的信息,打开浏览器输入[server_ip]:9090,在expression搜索框输入node_load1,点EXECUTE按钮,在下方的Graph中可看到node负载。
接下来我们在另一台node上也部署一个node_exporter并修改server配置文件,将新的node加入监控,步骤同上,prometheus配置文件如下:
vi /home/prometheus/prometheus/prometheus.ymlscrape_configs:
# The job name is added as a label `job=<job_name>` to any timeseries scraped from this config.
- job_name: 'node_exporter_server117'
static_configs:
- targets: ['10.x.x.117:9100']
- job_name: 'prometheus_server117'
# metrics_path defaults to '/metrics'
# scheme defaults to 'http'.
static_configs:
- targets: ['10.x.x.117:9090']
- job_name: 'node_exporter_server111'
static_configs:
- targets: ['10.x.x.111:9100']保存并退出,重启prometheus服务
systemctl restart prometheus在 Prometheus Web UI 的 Status -> Targets 中,可以看到新加的服务器。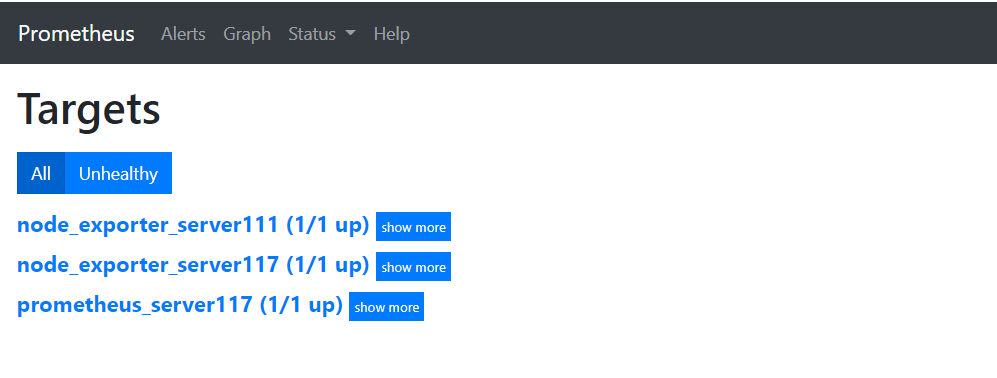
在Prometheus Web UI的Graph页面的指标下拉框可以看到很多名称以 node 开头的指标,可以选取查看所有node的指标
评论
登录后参与技术讨论,分享你的经验与见解。
登录 / 注册暂无评论