D3(v5) in TypeScript 坐标轴之 scaleBand用法

文章目录
在学习d3时候,发现在TS中实现D3的坐标轴中遇到一些错误,而这些错误却不会存在于js(因为ts的类型检查)写法中,因此做下笔记:
import * as d3 from 'd3';import * as React from 'react';class TestGraph extends React.Component { public componentDidMount() { const marge = { top: 60, bottom: 60, left: 60, right: 60 }; const dataSet: any[] = [10, 20, 30, 23, 13, 40, 27, 35, 20]; const svg = d3.select("svg"); const g = svg.append("g") .attr("transform", `translate(${marge.top},${marge.left})`); const width: any = svg.attr('width'); const height: any = svg.attr('height'); // 此处必须把.domain里的参数转为字符串数组,不然会报类型错 const xScale = d3.scaleBand() .domain(d3.range(dataSet.length).map(value => { return value.toString(); })) .rangeRound([0, width - marge.left - marge.right]); const xAxis = d3.axisBottom(xScale); const yScale = d3.scaleLinear() .domain([0, d3.max(dataSet)]) .range([height - marge.top - marge.bottom, 0]); const yAxis = d3.axisLeft(yScale); const gs = g.selectAll(".rect") .data(dataSet) .enter() .append("g"); const rectPadding = 20;// 矩形之间的间隙 const rectWidth = xScale.step(); gs.append("rect") .attr("x", (d, i) => { // 此处不能用xScale(i),因为参数只能接受string,就算使用i.toString(),也会报错此对象有可能为undefined return xScale.step() * (i + xScale.paddingOuter()) + rectPadding / 2; }) .attr("y", d => { return yScale(d); }) .attr("width", rectWidth - rectPadding) .attr("height", d => { return height - marge.top - marge.bottom - yScale(d); }) .attr("fill", "blue"); const fontSize = 14; gs.append("text") .attr("x", (d, i) => { return xScale.step() * (i + xScale.paddingOuter()) + rectPadding / 2; }) .attr("y", d => { return yScale(d); }) .attr("dx", (xScale.step() - rectPadding) / 2 - fontSize / 2) .attr("dy", 20) .attr("font-size", fontSize) .text(d => { return d; }); g.append("g") .attr("transform", `translate(0,0)`) .call(yAxis); g.append("g") .attr("transform", `translate(0,${yScale(0)})`) .call(xAxis); } public render() { return ( <svg width={960} height={600}/> ) }}export default TestGraph;
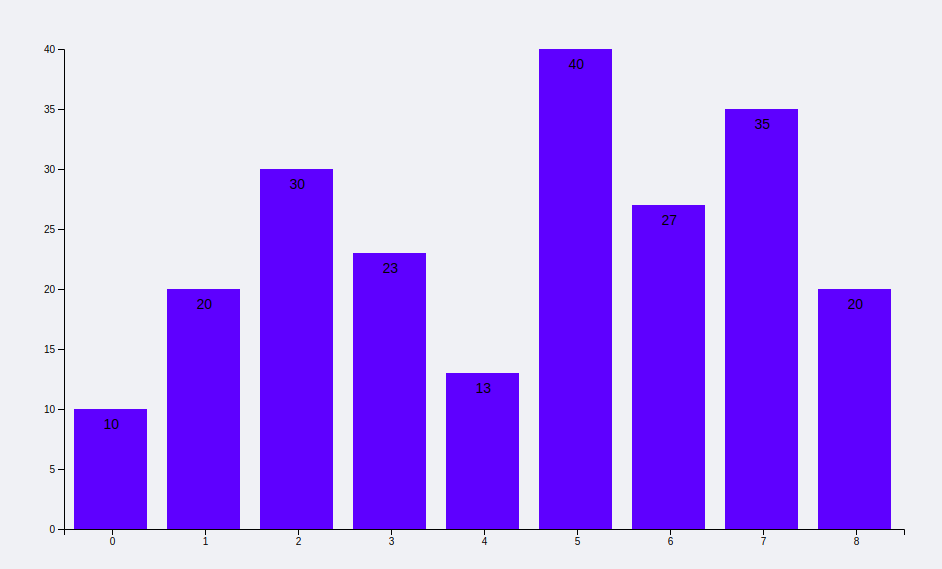
效果如下:
评论
登录后参与技术讨论,分享你的经验与见解。
登录 / 注册暂无评论