让你的数据动起来-动态柱状图

文章目录
作者:小伍哥
来源:AI入门学习
上次的动图画的差不多了,但是还差一个柱状图没画,重新补上。数据还是原来的数据,只是需要重新处理下,上文链接:让你的数据动起来!
提取绘图需要的数据,选择top10的国家
- data = gapminder
- select.country = c(as.character(head(data$country[data$year==2007][order(data$pop[data$year==2007],decreasing = TRUE)],10)))
- data = data[data$country %in%select.country,]
- data$country = factor(data$country, order = TRUE, levels =select.country)
制作Gif
- ggplot(data, aes(country, lifeExp,fill= country))+
- geom_bar(stat='identity', position ='dodge',show.legend = FALSE)+
- theme(axis.text.x = element_text(angle =45, hjust =0.5, vjust =0.5))+
- coord_flip()+
- labs(title ='Year: {frame_time}', x ='country', y ='life expectancy')+
- transition_time(year)+
- ease_aes('linear')
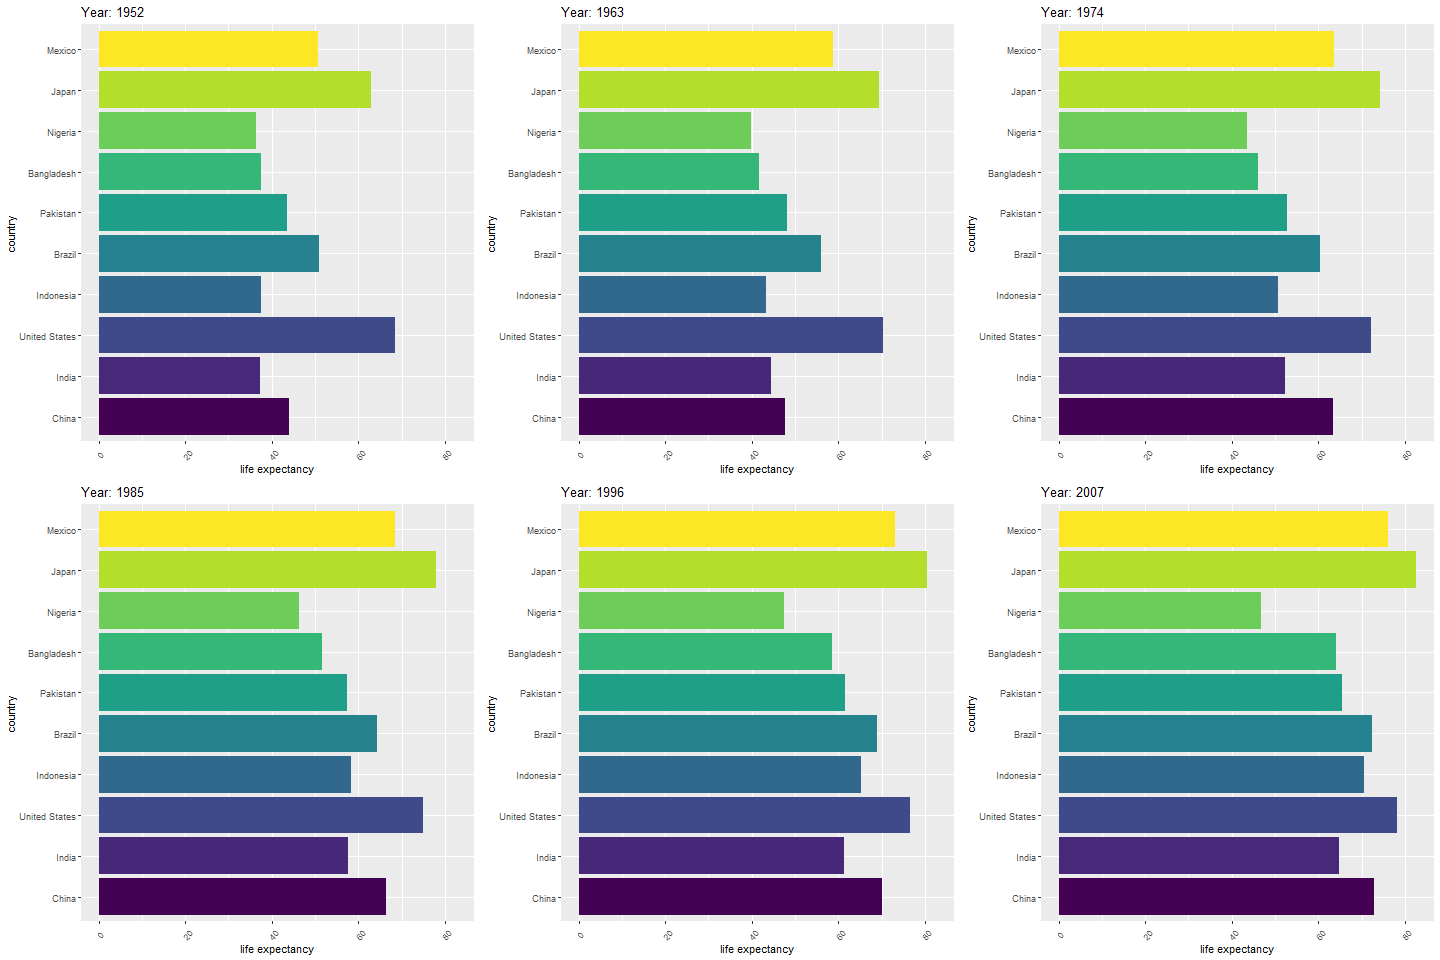
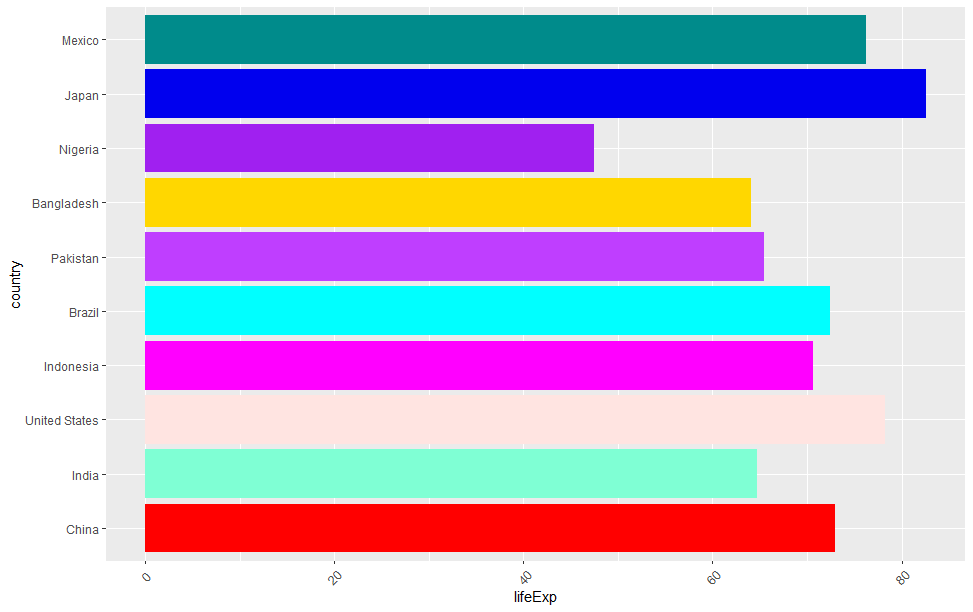
颜色有点丑,我们换个颜色看看
- ggplot(data, aes(country, lifeExp,fill= country)) +
- geom_bar(stat= 'identity', position = 'dodge',show.legend = FALSE) +
- theme(axis.text.x = element_text(angle = 45, hjust = 0.5, vjust = 0.5)) +
- coord_flip()+
- scale_fill_manual(values = alpha(c("red", 'Aquamarine1',"MistyRose", "Magenta","Cyan", "DarkOrchid1","Gold1","Purple","Blue2","DarkCyan")))+
- labs(title = 'Year: {frame_time}', x = 'country', y = 'life expectancy') +
- transition_time(year) +
- ease_aes('linear')
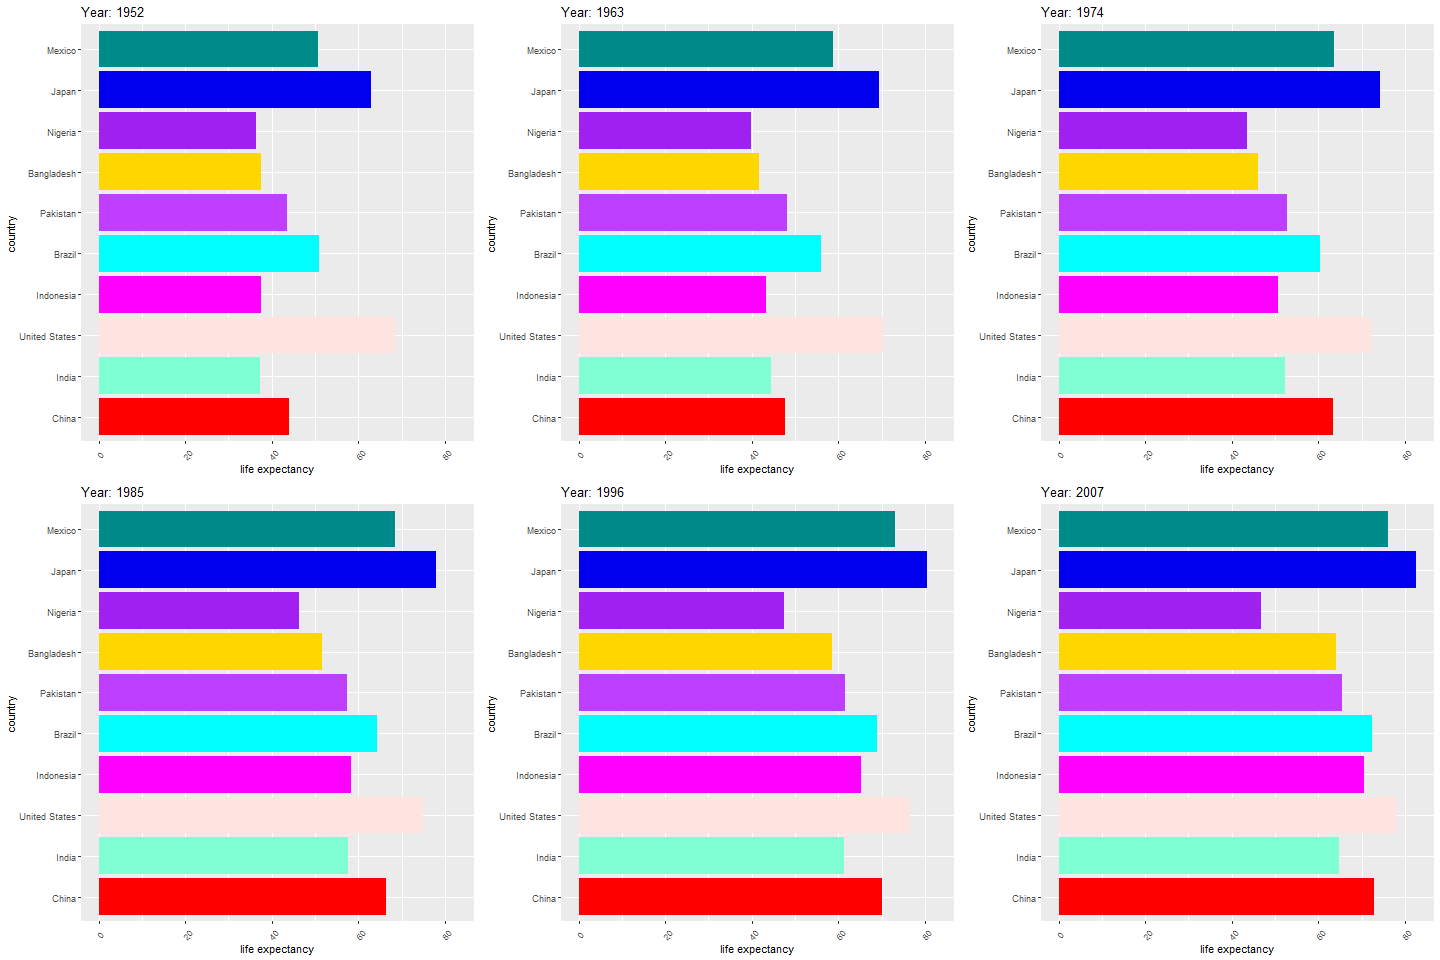
当然,这个也可以转换成视频,配上音乐,就是前段时间流行的图表了,制作比较简单!
评论
登录后参与技术讨论,分享你的经验与见解。
登录 / 注册暂无评论