matlab学习2-画线
文章目录
1、二维曲线
1.1plot(x,y,线性)
在【0,2pi】画sin(x),cos(x)的图
x=linspace(0,2*pi,30);
plot(x,sin(x),'r',x,cos(x),'-')
1.2符号函数画图ezplot('f(x)',[a,b])
1、在【0,pi】上画y=sin(x)
ezplot('sin(x)',[0,pi])2、在【0,2pi】画cos(t)^3,sin(t)^3,星图
ezplot('cos(t)^3','sin(t)^3',[0,2*pi])3、在[-2,0.5],[0,2]上画隐函数 exp(x)+sin(x*y)=0的图
ezplot('exp(x)+sin(x*y)',[-2,0.5,0,2])1.3flot('fun',lims)画图
fun是建立M文件或者是独立变量的x的字符串
fplot('[tanh(x),sin(x),cos(x)]',2*pi*[-1,1,-1,1])1.4对数坐标图

x=logspace(-1,2);
loglog(x,exp(x),'-s')
grid on
2、三维图像
2.1plot(x,y,z,线形)

t=0:pi/50:10*pi;
plot3(sin(t),cos(t),t)
rotate3d
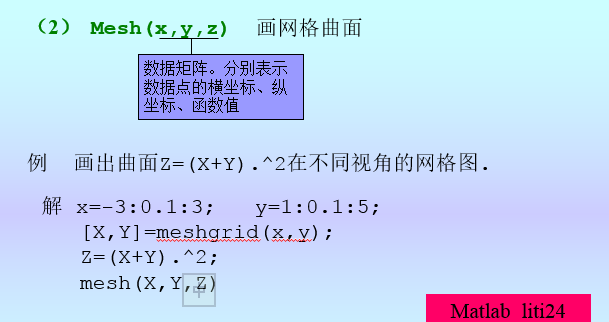
x=-3:0.1:3;y=1:0.1:5;
[X,Y]=meshgrid(x,y);%为了产生矩阵
Z=(X+Y).^2;
plot3(X,Y,Z)
2.2surf(x,y,z)画出数据点(x,y,z)表示的曲面

x=-3:0.1:3;
y=1:0.1:5;
[X,Y]=meshgrid(x,y);
Z=(X+Y).^2;
surf(X,Y,Z)
shading  flat%将图像变得平滑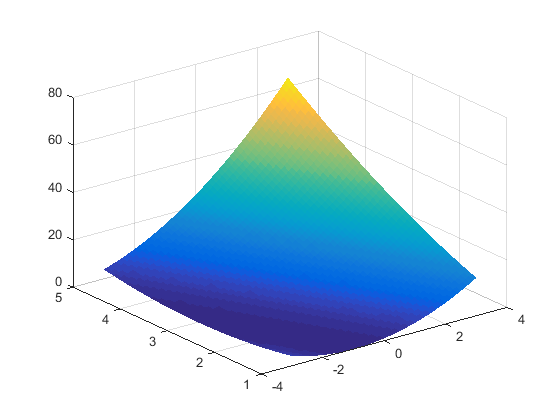
3、图像处理
3.1加坐标说明,表名,加格栅

3.2在图像的线上标注名称,gtext('名字')
x=linspace(0,2*pi,30);
 y=sin(x);
 z=cos(x);
 plot(x,y,x,z);
gtext('sin(x)');gtext('cos(x)')
3.3定制坐标Axis([xmin,xmax,ymin,ymax,zmin,zmax])

x=linspace(0.0001,0.01,1000);
 y=sin(1./x);
 plot(x,y)
axis([0.005,0.01,-1,1])
3.4分割窗口subplot

x=linspace(0,2*pi,100);
 y=sin(x); z=cos(x);
 a=sin(x).*cos(x);b=sin(x)./(cos(x)+eps)
 subplot(2,2,1);plot(x,y),title('sin(x)')
 subplot(2,2,2);plot(x,z),title('cos(x)')
 subplot(2,2,3);plot(x,a),title('sin(x)cos(x)')
 subplot(2,2,4);plot(x,b),title('sin(x)/cos(x)');
特殊函数图像
1、极坐标图polar (theta弧度,rho极半径,s)
theta=linspace(0,2*pi),
rho=sin(2*theta).*cos(2*theta);
polar(theta,rho,'g')
title('Polar plot of sin(2*theta).*cos(2*theta)');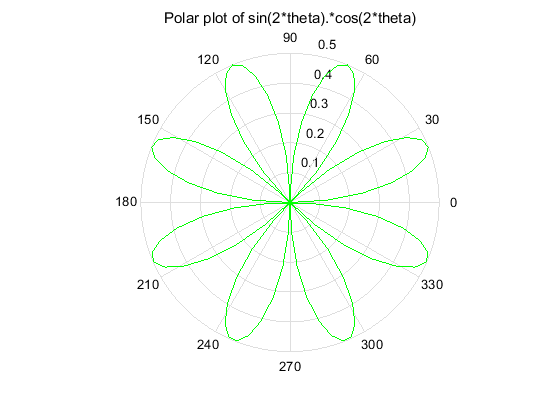
2、散点图、等值线平面图
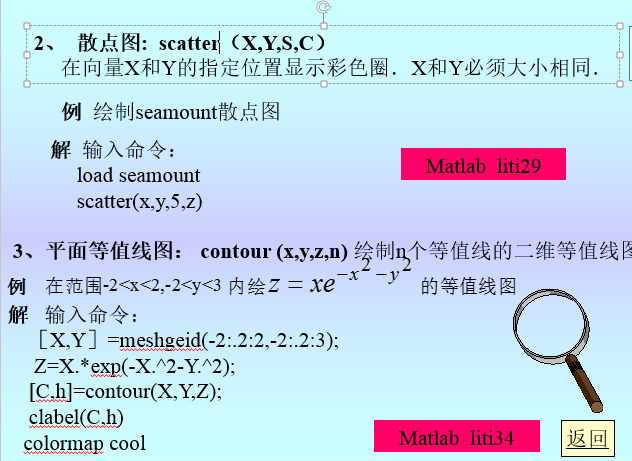
[X,Y]=meshgrid(-2:.2:2,-2:.2:3);
Z=X.*exp(-X.^2-Y.^2);
[C,h]=contour(X,Y,Z);
clabel(C,h)
colormap cool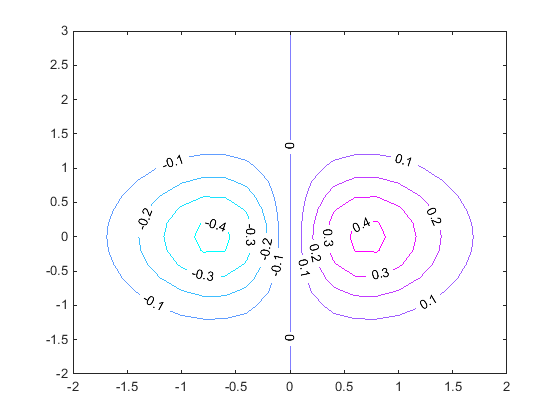
山峰的三维和二维等值线图。空间等值线图: contour 3(x,y,z,n),n为等值线数
[x,y,z]=peaks;
        subplot(1,2,1)
        contour3(x,y,z,16,'s')
        grid,   xlabel('x-axis'),ylabel('y-axis')
        zlabel('z-axis')
        title('contour3 of peaks');
        subplot(1,2,2)
        contour(x,y,z,16,'s')
        grid,  xlabel('x-axis'), ylabel('y-axis')
        title('contour of peaks');
评论
登录后参与技术讨论,分享你的经验与见解。
登录 / 注册暂无评论