Echarts饼状图 如何让0%的数据不显示数据?

文章目录
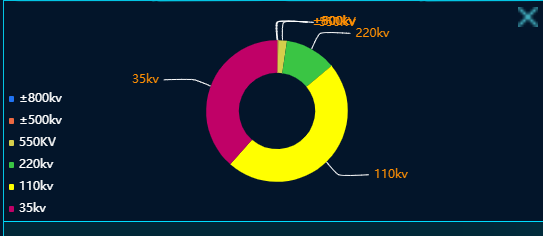
html我就不写出来了,这个className是id=“isShowSector”来的不是class=“isShowSector”,只是我名字改了一下,下面就是我的配置。
let nameArray= ["±800kv", "±500kv", "550KV", "220kv", "110kv", "35kv"];
let valueArray= [{value:6,name:"±800kv"},{value:14,name:"±500kv"},{value:151,name:"550KV"},{value:901,name:"220kv"},{value:3629,name:"110kv"},{value:2951,name:"35kv"}]
let className= "isShowSector";
let colorList = ['#2073f3', '#ec6941', '#d6ce4b', '#3ac544', '#ffff00', '#c00167'];
function createPercentage(nameArray, valueArray, colorList, className) {
         let myclass = echarts.init(document.getElementById(className));

            var option = {
                tooltip: {
                    trigger: 'item',
                    formatter: "{a} <br/>{b}: {c} ({d}%)",
                    position: ['60%', '60%'],
                    textStyle: {
                        fontSize: 8,
                        color: '#fff'
                    }
                },
                legend: [{

                    orient: 'auto',
                    itemWidth: 5,
                    itemHeight: 6,
                    height: '100%',
                    textStyle: { color: '#fff', fontSize: this.fontSize(12) },
                    width: '100%',
                    data: valueArray,
                    x: 'centent',
                    bottom: '0'
                    ,
                }],
                color: colorList,
                series: [{
                    name: null,
                    type: 'pie',
                    radius: ['35%', '65%'],
                    avoidLabelOverlap: false,
                    center: ['50%', '50%'],
                    labelLine: {
                        normal: {
                            show: true,
                            lineStyle: {
                                color: '#fff'
                            },
                            smooth: 0.2,
                            length: 18,
                            length2: 30,
                        }
                    },
                    label: {

                        normal: {
                            show: true,
                            textStyle: {
                                color: '#ff8f03'
                            },

                        },
                        emphasis: {
                            show: true,
                            textStyle: {
                                fontSize: '14',
                                fontWeight: 'bold'
                            }
                        }
                    },
                    data: valueArray
                }]
            };
            myChart.setOption(option);
            window.addEventListener("resize", function () {

                myChart.resize();
            })

        }
评论
登录后参与技术讨论,分享你的经验与见解。
登录 / 注册暂无评论