Python-geopandas 中国地图绘制

文章目录
上一期的地图可视化推文教程R-ggplot2 标准中国地图制作中,我们详细介绍了使用R-ggplot2 包完美绘制中国标准地图,本期推文我们则试着使用Python-geopandas包绘制空间地图,主要的知识点如下:
geopandas 绘制中国地图
matplotlib add_axes()添加南海小地图
绘图文件分享
geopandas 读取中国地图文件
geopandas提供了非常方便的read_file()方法用于读取geojson文件,我们直接进行默认投影(WGS84)的绘制,代码如下:
file = r"中国省级地图GS(2019)1719号.geojson"
nine = r"九段线GS(2019)1719号.geojson"
china_main = gpd.read_file(file)
china_nine = gpd.read_file(nine)
fig, ax = plt.subplots(figsize=(12, 8),dpi=80)
ax = china_main.plot(ax=ax)
ax = china_nine.plot(ax=ax)
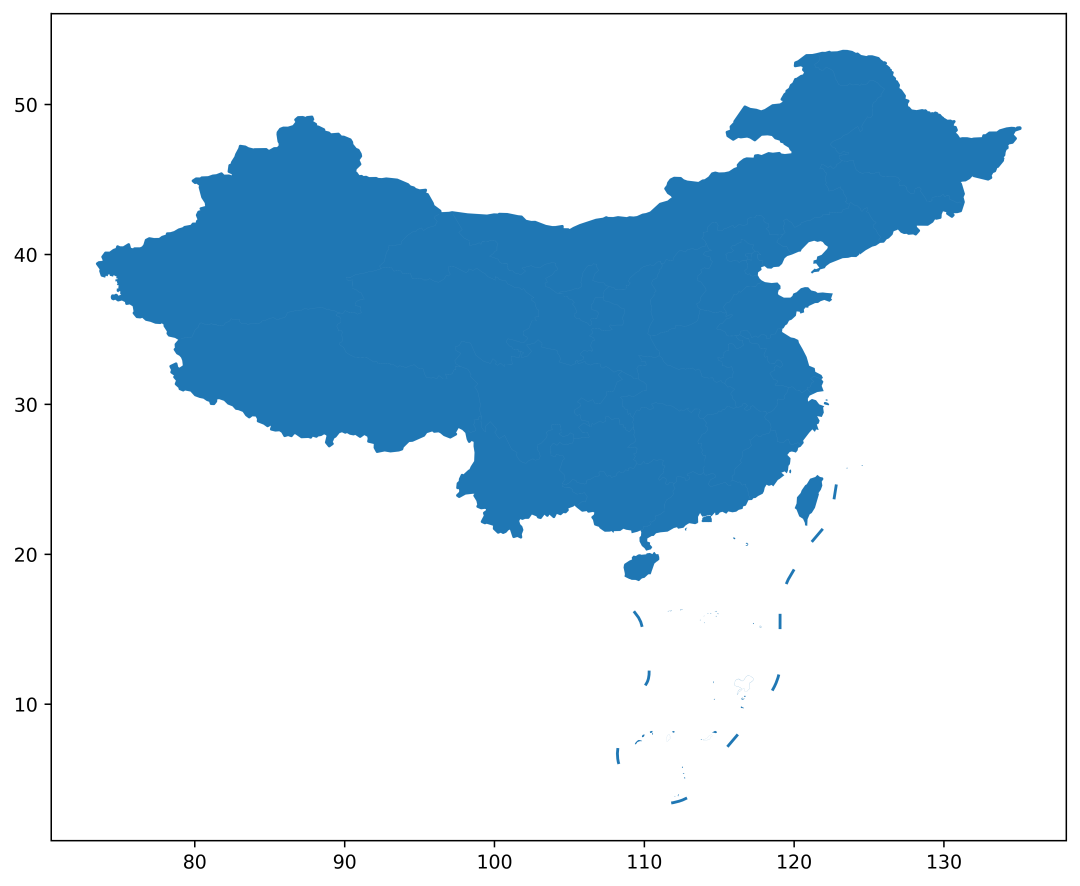
可视化结果如下:
我们进行投影转换(epsg=2343)和进行一些简单的设置,代码如下:
`fig, ax = plt.subplots(figsize=(12, 8),dpi=80)
ax = china_main.geometry.to_crs(epsg=2343).plot(fc="white",ec="black",ax=ax)
ax = china_nine.geometry.to_crs(epsg=2343).plot(ec="black",ax=ax)
`
这里注意to_crs(epsg=2343) 就可以进行投影转换了。
绘图数据操作
接下来,我们将我们要绘制的数据读取、转换并绘制在地图上,数据预览如下: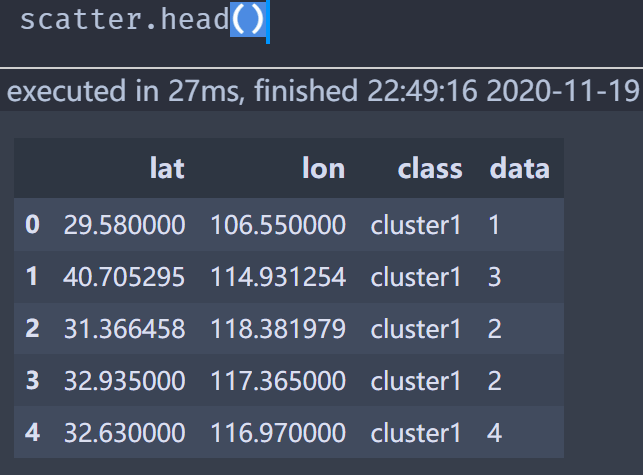
我们使用如下代码将其转换成具有地理信息的geopandas 格式数据:
scattergdf = gpd.GeoDataFrame(
    scatter, geometry=gpd.points_from_xy(scatter.lon, scatter.lat),
    crs="EPSG:4326")
scattergdf.head()
结果如下: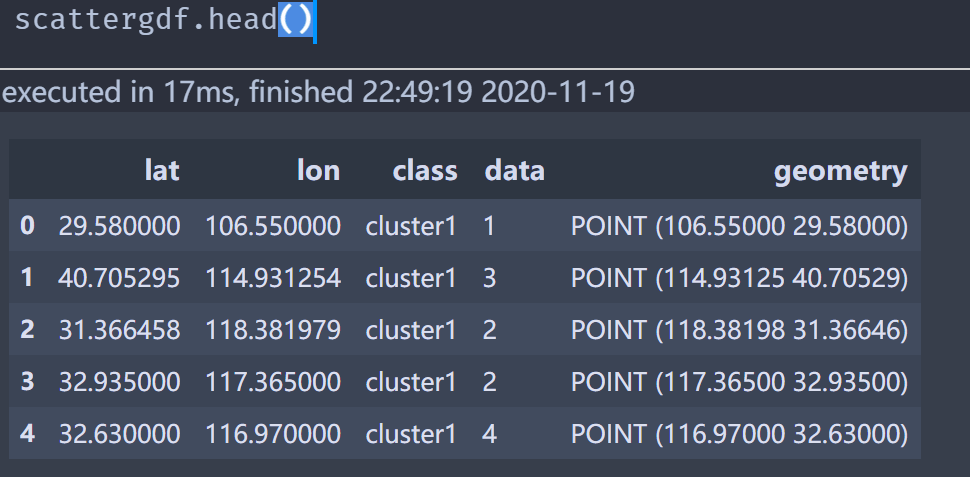
接下来再将其转换成 epsg=2343 投影下的数据:
scattergdf_2343 = scattergdf.to_crs(epsg=2343, inplace=True)
以上就完成的数据的处理操作了
地图可视化绘制
直接给出绘图代码,然后再进行解释。主要代码如下:
fig, ax = plt.subplots(figsize=(8,5),dpi=200,)
plt.rcParams['font.family'] = ['Times New Roman']

ax = china_main.geometry.to_crs(epsg=2343).plot(fc="white",ec="black",linewidth=.8,ax=ax)
ax = china_nine.geometry.to_crs(epsg=2343).plot(color="gray",linewidth=.9,ax=ax)

for loc, size,class_name in zip(scattergdf_2343.geometry.representative_point(),\
                                scattergdf_2343["data"],scattergdf_2343["class"]):
    ax.scatter(loc.x,loc.y,s=10*size,fc=class_color[class_name],ec="black",lw=.5,zorder=2)
#添加刻度线
for spine in ['top','left',"bottom","right"]:
    ax.spines[spine].set_color("none")

ax.set_xlim(china_nine_2343.geometry[0].x-500000, china_nine_2343.geometry[1].x)
ax.set_ylim(china_nine_2343.geometry[0].y, china_nine_2343.geometry[1].y)
ax.set_xticks([])
ax.set_yticks([])
#单独绘制图例散点
ax.scatter([], [], c='#E21C21', s=30,  label='cluster1',ec="black",lw=.5)
ax.scatter([], [], c='#3A7CB5', s=30,  label='cluster2',ec="black",lw=.5)
ax.scatter([], [], c='#51AE4F', s=30,  label='cluster3',ec="black",lw=.5)

ax.scatter([], [], c='white', s=1*10,label='1', edgecolor='black',lw=.5)
ax.scatter([], [], c='white', s=2*10,label='2', edgecolor='black',lw=.5)
ax.scatter([], [], c='white', s=3*10,label='3', edgecolor='black',lw=.5)
ax.scatter([], [], c='white', s=4*10,label='4', edgecolor='black',lw=.5)
ax.scatter([], [], c='white', s=5*10,label='5', edgecolor='black',lw=.5)

ax.legend(frameon=False,ncol=8,loc="upper center",
         fontsize=9,columnspacing=.2)

ax.text(.91,-0.02,'\nVisualization by DataCharm',transform = ax.transAxes,
        ha='center', va='center',fontsize = 6,color='black')

#添加南海小地图
ax_child = fig.add_axes([0.688, 0.125, 0.2, 0.2])
ax_child = china_main.geometry.to_crs(epsg=2343).plot(ax=ax_child,
                                                        fc="white",
                                                        ec="black",)
ax_child = china_nine.geometry.to_crs(epsg=2343).plot(ax=ax_child,
                                                        color="gray",
                                                        linewidth=.9,
                                                        )

for loc, size,class_name in zip(scattergdf_2343.geometry.representative_point(),\
                                scattergdf_2343["data"],scattergdf_2343["class"]):
    ax_child.scatter(loc.x,loc.y,s=10*size,fc=class_color[class_name],ec="black",lw=.5,zorder=2)

ax_child.set_xlim(china_nine_2343.geometry[2].x, china_nine_2343.geometry[3].x)
ax_child.set_ylim(china_nine_2343.geometry[2].y, china_nine_2343.geometry[3].y)
# 移除子图坐标轴刻度,
ax_child.set_xticks([])
ax_child.set_yticks([])
- add_axes() 添加南海小地图
#添加南海小地图
ax_child = fig.add_axes([0.688, 0.125, 0.2, 0.2])
ax_child = china_main.geometry.to_crs(epsg=2343).plot(ax=ax_child,
                                                        fc="white",
                                                        ec="black",)
ax_child = china_nine.geometry.to_crs(epsg=2343).plot(ax=ax_child,
                                                        color="gray",
                                                        linewidth=.9,
                                                        )

for loc, size,class_name in zip(scattergdf_2343.geometry.representative_point(),\
                                scattergdf_2343["data"],scattergdf_2343["class"]):
    ax_child.scatter(loc.x,loc.y,s=10*size,fc=class_color[class_name],ec="black",lw=.5,zorder=2)

ax_child.set_xlim(china_nine_2343.geometry[2].x, china_nine_2343.geometry[3].x)
ax_child.set_ylim(china_nine_2343.geometry[2].y, china_nine_2343.geometry[3].y)
# 移除子图坐标轴刻度,
ax_child.set_xticks([])
ax_child.set_yticks([])
可以发现,除了显示范围的不同外,其他的和绘制主题部分的代码一致。
- 单独添加图例
#单独绘制图例散点
ax.scatter([], [], c='#E21C21', s=30,  label='cluster1',ec="black",lw=.5)
ax.scatter([], [], c='#3A7CB5', s=30,  label='cluster2',ec="black",lw=.5)
ax.scatter([], [], c='#51AE4F', s=30,  label='cluster3',ec="black",lw=.5)

ax.scatter([], [], c='white', s=1*10,label='1', edgecolor='black',lw=.5)
ax.scatter([], [], c='white', s=2*10,label='2', edgecolor='black',lw=.5)
ax.scatter([], [], c='white', s=3*10,label='3', edgecolor='black',lw=.5)
ax.scatter([], [], c='white', s=4*10,label='4', edgecolor='black',lw=.5)
ax.scatter([], [], c='white', s=5*10,label='5', edgecolor='black',lw=.5)

ax.legend(frameon=False,ncol=8,loc="upper center",
         fontsize=9,columnspacing=.2)
这部分还是为了更好的定制化图例,希望大家可以掌握。
最终,我们的可视化效果如下: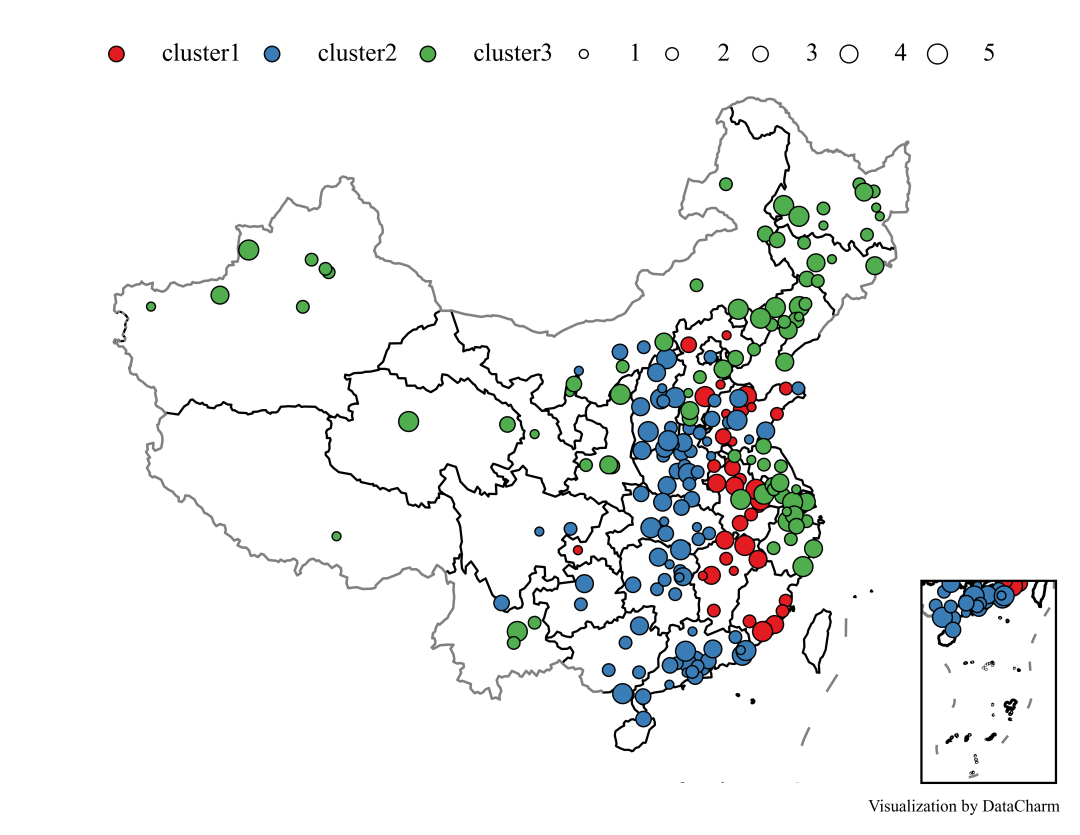
注:该数据只限于练习交流,请勿用于科研、出版使用**。**
总结
本期推文使用了Python-geopandas进行了中国地图的绘制,讲解了数据标记,投影转换等内容。但需指出的是:
geopandas 的安装较为麻烦,建议使用 conda install --channel conda-forge geopandas 进行安装。
Python 绘制空间可视化还是存在部分问题(无法较容易的添加如比例尺、指北针等空间绘图元素),也在进一步完善过程中。
**-----**------**-----**---**** End **-----**--------**-----**-****
往期精彩文章推荐:

欢迎各位大佬点击链接加入群聊【helloworld开发者社区】:https://jq.qq.com/?_wv=1027&k=mBlk6nzX进群交流IT技术热点。
本文转自 https://mp.weixin.qq.com/s/kxcqyeya2TT0vhxWW3d_fQ,如有侵权,请联系删除。
评论
登录后参与技术讨论,分享你的经验与见解。
登录 / 注册暂无评论