Data-可视化-04 graphviz树状图

文章目录
Data-可视化-04 graphviz树状图
Numbers have an important story to tell. They rely on you to give them a clear and convincing voice. -- Stephen Few
1. Graphviz介绍与配置
- Graphviz库通过创建图形对象,添加节点和边来组装图形,可以在Jupyter Notebook和Jupyter Qt中呈现和显示图形。
-
使用anaconda进行安装,在终端输入命令
conda install -n data_env_37 python-graphviz- (注意,若用conda安装
graphviz而非python-graphviz则会提示没有graphviz库)
- (注意,若用conda安装
2. 示例代码
【基本绘图】
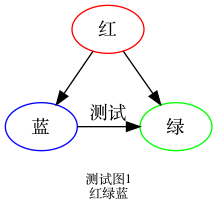
'''最基本的图'''
from graphviz import Digraph

dot = Digraph('图1')

dot.node('A', '红', color='red')
dot.node('B', '蓝', color='blue')
dot.node('C', '绿', color='green')

dot.edges(['AB', 'AC'])
dot.edge('B', 'C', constraint='false', label='测试')

dot.attr(label=r'\n测试图1\n红绿蓝')
dot.attr(fontsize='10')

# 导出图片
dot.render(filename='04-01', directory='./', format='png', cleanup='true')

dot
【应用HTML】

dot = Digraph('图2')

dot.node('tab', label='''<<TABLE>
    <TR>
        <TD>left</TD>
        <TD>right</TD>
    </TR>
    </TABLE>>''')
【变换形状、线条和颜色】
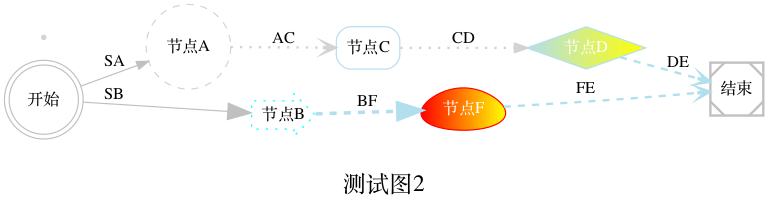
dot = Digraph(comment='图2', filename='图2.gv')
dot.attr(rankdir='LR', size='8,5')

dot.attr('node', shape='doublecircle', style='solid')
dot.node('S', '开始', color='gray')

dot.attr('node', shape='Msquare', style='bold')
dot.node('E', '结束', color='gray')

dot.attr('node', shape='circle', style='dashed', color='lightgrey')
dot.node('A', '节点A')

dot.attr('node', shape='rarrow', style='dotted', color='lightgrey')
dot.node('B', '节点B', color='cyan')

dot.attr('node', shape='box', style='rounded')
dot.node('C', '节点C', color='lightblue2')

dot.attr('node', shape='diamond', style='filled')
dot.node('D', '节点D', color='lightblue2:yellow', fontcolor='white')

dot.attr('node', shape='egg', style='filled')
dot.node('F', '节点F', color='red:yellow', fontcolor='white')

dot.attr('node', shape='point')
dot.node('G', '节点G')

dot.edge('S', 'A', label='SA', color='gray')
dot.edge('S', 'B', label='SB', color='gray', arrowsize='2.0')

dot.attr('edge', style='dotted', penwidth='2.0')
dot.edge('A', 'C', label='AC', color='lightgrey', arrowhead='vee')
dot.edge('C', 'D', label='CD', color='lightgrey', arrowhead='normal')

dot.attr('edge', style='dashed', penwidth='3.0')
dot.edge('B', 'F', label='BF', color='lightblue2', arrowsize='2.0')

dot.attr('edge', style='dashed', penwidth='2.0')
dot.edge('D', 'E', label='DE', color='lightblue2', arrowhead='vee')
dot.edge('F', 'E', label='FE', color='lightblue2', arrowhead='vee')

dot.attr(label=r'\n测试图2')
dot.attr(fontsize='20')
【子图】

g = Digraph('G')
g.attr(rankdir='TB', compound='true')

with g.subgraph(name='cluster0') as c:
    c.edges(['ab', 'ac', 'bd', 'cd'])

with g.subgraph(name='cluster1') as c:
    c.edges(['eg', 'ef'])

g.edge('b', 'f', lhead='cluster1')
g.edge('d', 'e')
g.edge('c', 'g', ltail='cluster0', lhead='cluster1')
g.edge('c', 'e', ltail='cluster0')
g.edge('d', 'h')
评论
登录后参与技术讨论,分享你的经验与见解。
登录 / 注册暂无评论