VUE+Echarts 创建项目

文章目录
1. 使用cnpm添加vue-cli
安装cnpm
由于npm的服务器在国外,网速很慢。淘宝为解决这个问题,在国内做了同步的镜像网站 http://npm.taobao.org/,我们可以安装国内镜像cnpm,以提高modules的安装速度npm install cnpm -g
vue-cli脚手架 全局安装
cnpm install -g @vue/cli
安装yarn
使用cnpm全局安装yarn,在项目中可以直接使用yarn安装模块,比npm速度更快(这一部分可不用做,可以延续使用cnpm)cnpm install -g yarn
2. 初始化vue+Echarts项目
创建vue项目
vue create projectname选择默认设置
跳转到项目目录中
cd projectname
运行项目
使用yarn serve运行项目,并在浏览器中使用 http://localhost:8080 访问
看到如下界面,则说明vue项目创建成功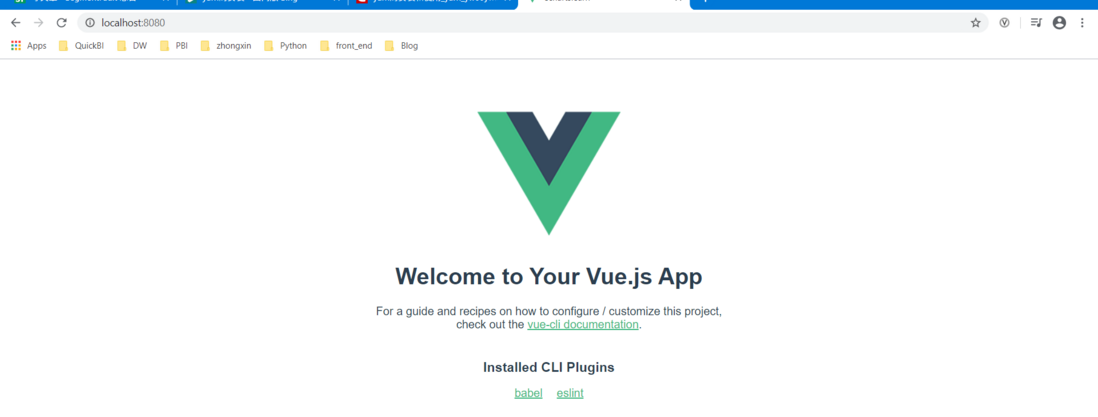
cnpm添加echarts
在项目根目录下使用cnpm安装echartscnpm install echarts@4 --save
3. 创建第一个图形
全局引入(不推荐)
在main.js中全局引用echarts
// 引入echarts
import echarts from 'echarts'
Vue.prototype.$echarts = echarts
在BarChart.vue中引用创建div,用于放置柱状图,并在script标签中配置组成元素。,因为要确保BarChart挂载到页面中,所以需要在mounted函数中渲染
<template>标签中
<template>
  <div id="barchart">
  </div>
</template>

<script>
export default {
  name: 'hello',
  data () {
    return {
      msg: 'Welcome to Your Vue.js App'
    }
  },
  mounted(){
    this.drawLine();
  },
  methods: {
    drawLine(){
        // 基于准备好的dom,初始化echarts实例
        let myChart = this.$echarts.init(document.getElementById('barchart'))
        // 绘制图表
        myChart.setOption({
            title: { text: '在Vue中使用echarts' },
            tooltip: {},
            xAxis: {
                data: ["衬衫","羊毛衫","雪纺衫","裤子","高跟鞋","袜子"]
            },
            yAxis: {},
            series: [{
                name: '销量',
                type: 'bar',
                data: [5, 20, 36, 10, 10, 20]
            }]
        });
    }
  }
}
</script>

<!-- Add "scoped" attribute to limit CSS to this component only -->
<style scoped>
#barchart{
  width: 600px;
  height: 400px;
}
</style>
在app.vue中引入组件BarChart.vue
<script>
import BarChart from './components/BarChart.vue'

export default {
  name: 'app',
  components: {
    BarChart
  }
}
</script>
局部引入
因为使用全局引入时会将所有图形都打包到文件中,造成文件非常大的问题。所以在项目中推荐使用 按需引入 的方式,只将用到的图形打包到文件中,大大缩小了打包的文件大小,加载速度更快。
只需要改动BarChart.vue
<template>
  <div id="barchart">
  </div>
</template>

<script>
// 引入基本模板
let echarts = require('echarts/lib/echarts')
// 引入柱状图组件
require('echarts/lib/chart/bar')
// 引入提示框和title组件
require('echarts/lib/component/tooltip')
require('echarts/lib/component/title')
export default {
  name: 'hello',
  data () {
    return {
      msg: 'Welcome to Your Vue.js App'
    }
  },
  mounted(){
    this.drawLine();
  },
  methods: {
    drawLine(){
        // 基于准备好的dom,初始化echarts实例
        let myChart = echarts.init(document.getElementById('barchart'))
        // 绘制图表
        myChart.setOption({
            title: { text: '在Vue中使用echarts' },
            tooltip: {},
            xAxis: {
                data: ["衬衫","羊毛衫","雪纺衫","裤子","高跟鞋","袜子"]
            },
            yAxis: {},
            series: [{
                name: '销量',
                type: 'bar',
                data: [5, 20, 36, 10, 10, 20]
            }]
        });
    }
  }
}
</script>

<!-- Add "scoped" attribute to limit CSS to this component only -->
<style scoped>
#barchart{
  width: 600px;
  height: 400px;
}
</style>
显示结果: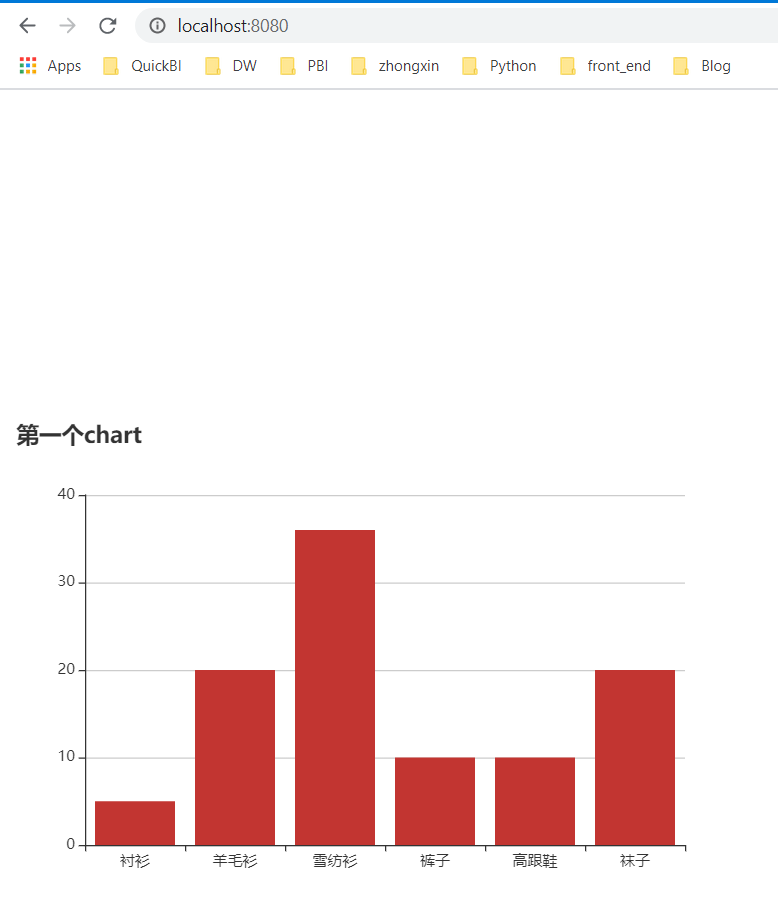
评论
登录后参与技术讨论,分享你的经验与见解。
登录 / 注册暂无评论