拓端tecdat|R语言绘制生存曲线估计|生存分析|如何R作生存曲线图

文章目录
原文链接:http://tecdat.cn/?p=6087
根据生存曲线的估计,可以推断出相比组之间存活时间的差异,因此生存曲线非常有用,几乎可以在每个生存分析中看到。
例
=
在我们将对象放入ggsurvplot()函数之后,我们可以创建简单的生存曲线估计。让我们来看看患有卵巢癌(_卵巢浆液性囊腺癌_)和患有乳腺癌(_乳腺浸润癌_)的患者之间存活时间的差异 。
survivalTCGA(BRCA.clinical, OV.clinical,
             extract.cols = "admin.disease_code") -> BRCAOV.survInfo
library(survival)
fit <- survfit(Surv(times, patient.vital_status) ~ admin.disease_code,
               data = BRCAOV.survInfo)
# Visualize with survminer
ggsurvplot(fit, data = BRCAOV.survInfo, risk.table = TRUE)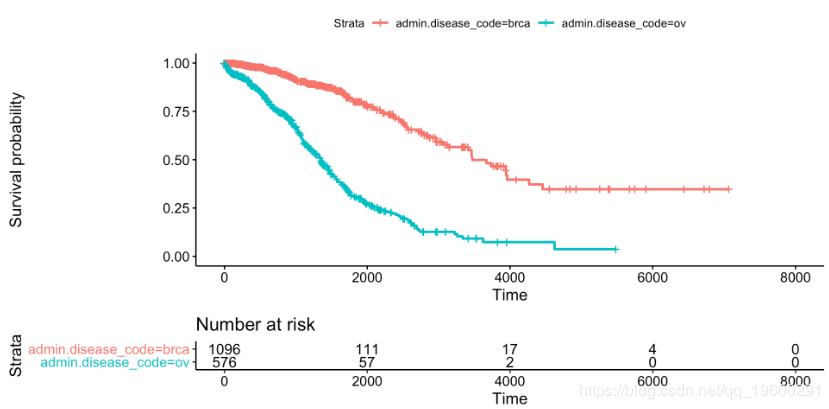
这个简单的图表以优雅的方式呈现了生存概率的估计值,该估计值取决于根据癌症类型分组的癌症诊断天数和信息风险集表,其中显示了在特定时间段内观察的患者数量。生存分析是一个特定的数据分析领域,因为事件数据的审查时间,因此风险集大小是视觉推理的必要条件。
ggsurvplot(
   fit,                     # survfit object with calculated statistics.
   data = BRCAOV.survInfo,  # data used to fit survival curves.
   risk.table = TRUE,       # show risk table.
   pval = TRUE,             # show p-value of log-rank test.
   conf.int = TRUE,         # show confidence intervals for
                            # point estimaes of survival curves.
   xlim = c(0,2000),        # present narrower X axis, but not affect
                            # survival estimates.
   break.time.by = 500,     # break X axis in time intervals by 500.
   ggtheme = theme_minimal(), # customize plot and risk table with a theme.
 risk.table.y.text.col = T, # colour risk table text annotations.
  risk.table.y.text = FALSE # show bars instead of names in text annotations
                            # in legend of risk table
)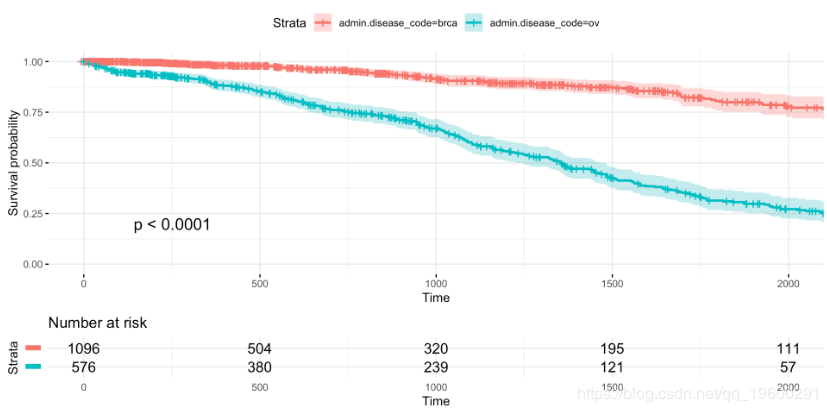
每个参数都在相应的注释中描述,但我想强调xlim控制X轴限制但不影响生存曲线的参数,这些参数考虑了所有可能的时间。
比较
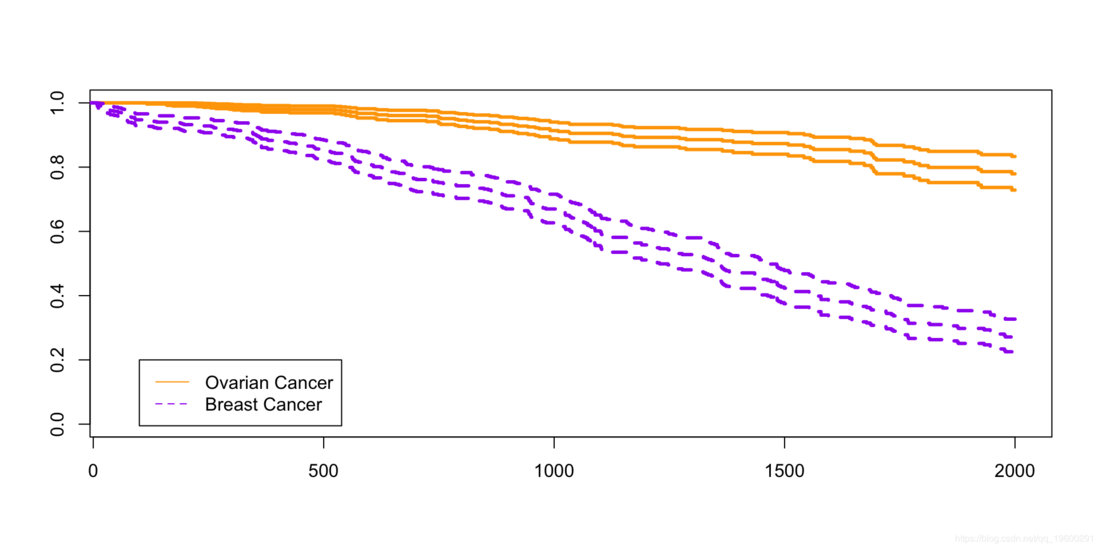
基础包

看起来很漂亮.....
评论
登录后参与技术讨论,分享你的经验与见解。
登录 / 注册暂无评论