Prometheus——可视化Grafana

文章目录
官方地址https://grafana.com/grafana/
安装
官方下载地址https://grafana.com/grafana/download
MacOS
建议通过brew
brew install grafana
或者二进制安装
wget https://dl.grafana.com/oss/release/grafana-6.7.1.darwin-amd64.tar.gz
tar -zxvf grafana-6.7.1.darwin-amd64.tar.gz
Docker
$ docker run -d --name=grafana -p 3000:3000 grafana/grafana
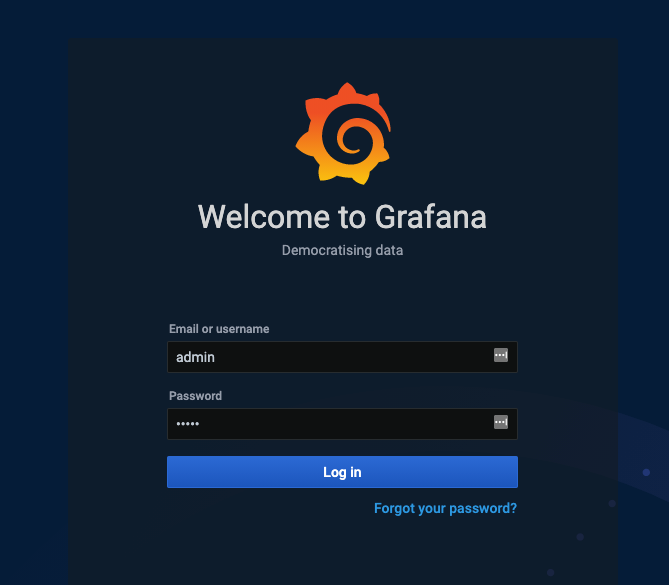
登录http://localhost:3000/login,默认用户名和密码都是admin
WelcometoGrafana
Democratisingdata
EmallorUserame
admin
Password
Login
Forgotyourpassword?
欢迎界面

Remevethlgpasnc
Basic
DATASOURCES
THARtEPaBeLOwYal
GULDEYyOULoOucty
Addyourfrstdatasource
Createyourfirstdashboard
Gratanafundamentals
Bntthseitngupyour
SEtUpandUndeRstandGrtenaLtyohhavenoporexPeence
LAORSLGJIctueteploceaodco
服
忘GAIRCNAnDDARHHOardE.LOPSTotherIghL
LEUNhowntheDOcBC
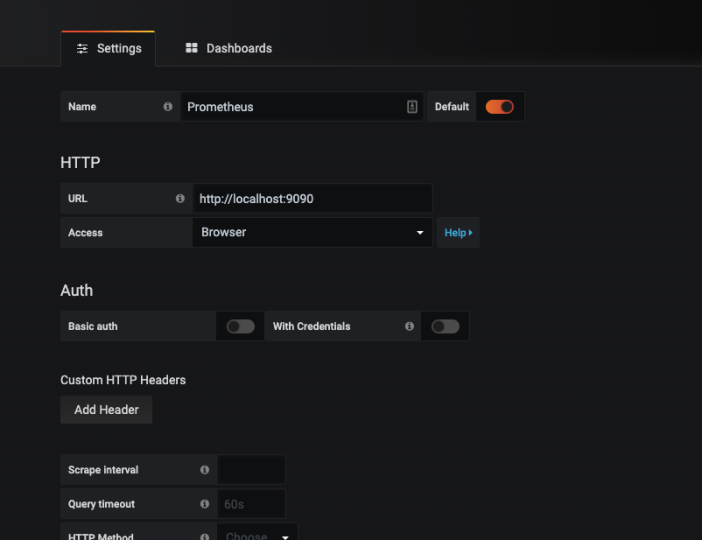
选择添加数据源
Dashboards
Settings
prometheus
Default
Name
HTTP
URL
Browser
Help?
Access
Auth
Basicauth
WithCredentials
CustomHTTPHeaders
ADDHEAdeR
Scrapeinterval
6
QUErytIMeout
60s
HTTPMethod
Chonse
Type:Prometheus
Dashboards
GSettings
lmport
Prometheus2.0Stats
CRuNQUErY
Prometheus
CleErAII
Explore
oLast1hour
0.13
qo-goroutincs
0qu6rcyhlstory
15:20
VAluEIA
2020-03-2716:09:57
GOgorutlnes
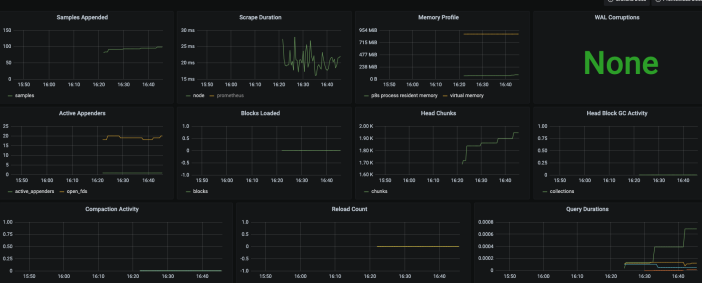
WALCOWTLOTIONA
None
16:05
16C0161015291639
14:10
1449
CorPactionNetty
QueryDurstione
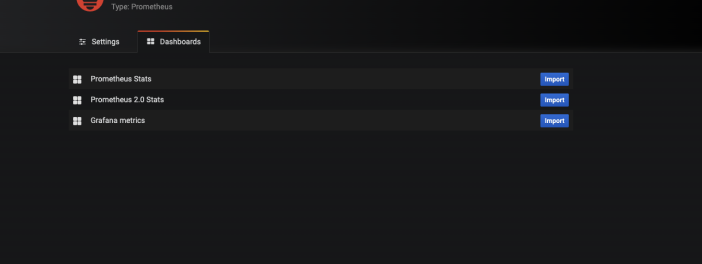
导入
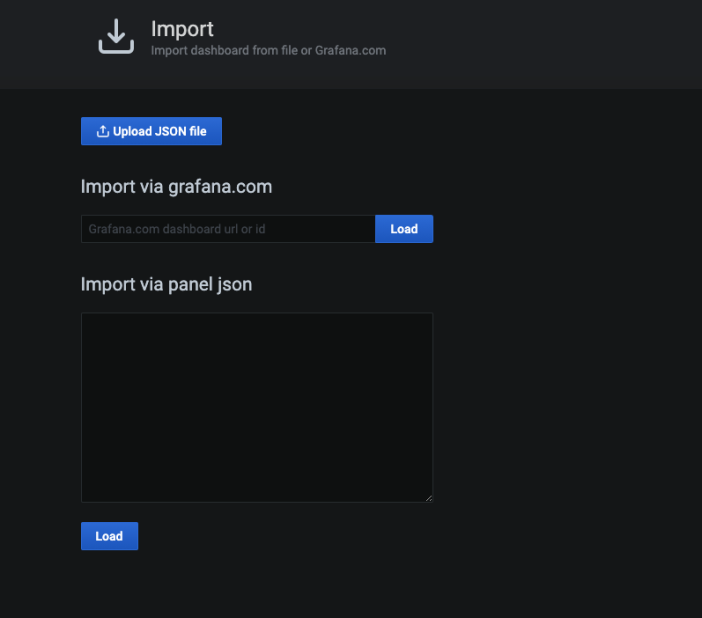
lmport
lmportdashboardfromfleorGrafana.com
BUPloaDJSonfle
lmportviagrafana.com
Grafana.comdashboardurlorid
Load
lmportviapaneljson
Load
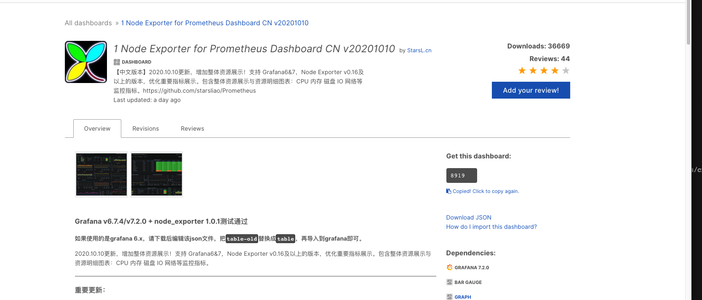
Grafana社区鼓励用户分享Dashboard通过https://grafana.com/dashboards网站,可以找到大量可直接使用的
dashooarosINodeExorPromthcusDasnboardCN2101
DOWnLoADa:36669
1NodeExporterforPrometheusDashboardn211
bystarsl.cn
[中文饭]20201010克艺习来!货tm7NOd.Exare
以上的丰,优化生标展含奖终完来示与费欢的组些:CPU内存盘10网钻等
ADDyourrevicwE
德冲指棉.httos:igtrub.comtaropromethes
Gcobestdlctteccymaan.
Gratanav6.7.4/v7.2.0+node-oxportor1.0.1渊试过
HawdoLmoonttNsdas*boa1a7
n文伴.cabi-o1wtabie到grn可
如果使用的是gr&tana6,请下后建动90n文件,史
Dependencies:
29291010址卖
外泰呵太:CPU内存查1岗培季蓝
重要更新:
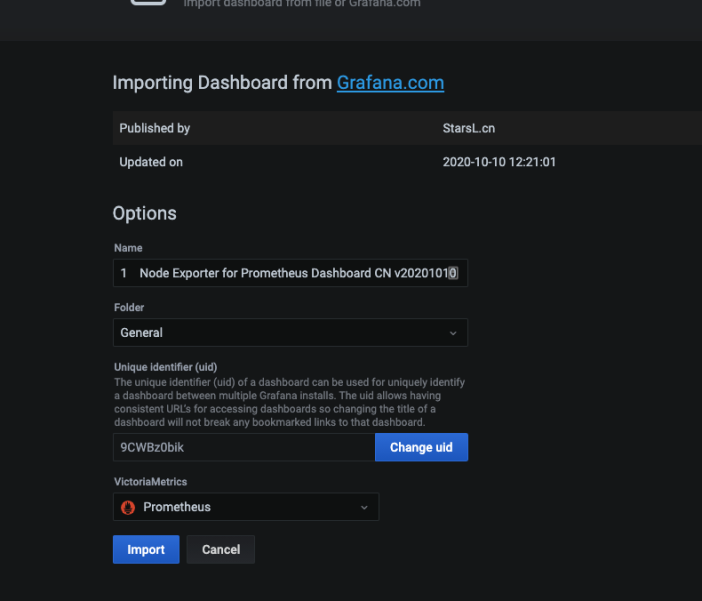
lmportdashboardTommleorGfatana.com
lmportigDashboardfromGrfana.com
Publishedby
StarsL.cn
Updatedon
2020-10-1012:21:01
Options
Name
NodeExporterforPromethesDashboardcn2201010
FoLder
General
UnIqueIDentifier(uid
THeunlqueIdentfer(uIdofadashboardcanbeedonqely
adashboardbetweenmulpleGfaninstaThw
ConsIstentURLSToRacCESSINgdashboardssochanginghe
dashboardwilnotbreakanybookmarkedinkshh
Changeuid
9cWBzobiK
VIctoriaMetrics
Prometheus
lmport
Cancel

INodeBxpoRTerforPrometheusDashboardcN2201010
dLant12hours
贵配总览
当前选中主机:
竖务学香赛版路装100:00机点料
杨肉烩俱
上牛泽欢
CPU州开视串
69时
整体总磁贡与姿体平均西重用率
嘉体总负尹与疆体平均CPU亿用率
nOd:整体总内存与疆体甲均有子让用本
语5GID
76.76
235C
7650
IR6CB
益a元
敬平沟横务车C018老:300%
汽楼NCuTeI2.Cao
点途量CuTe4920用量Cu8
岛肉CUTEN3GRAC
总B分钟药蓝CUTemt0.010
[VM-Q-2-ubuntu]
贵期细
每小封道量AI1
与行时间
[VM-Q-2-ubuntu]:各分区可用空库ExT.*rxF5)
参考
https://grafana.com/docs/grafana/latest/dashboards/export-import/
本文同步分享在 博客“羊羽”(other)。
如有侵权,请联系 support@oschina.cn 删除。
本文参与“OSC源创计划”,欢迎正在阅读的你也加入,一起分享。
评论
登录后参与技术讨论,分享你的经验与见解。
登录 / 注册暂无评论