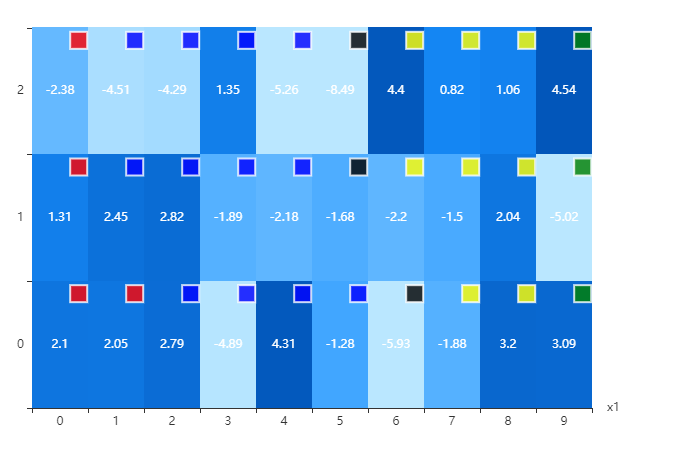
scatter的形状可以改成任何需要的形状
<!DOCTYPE html>
<html lang="en">
<head>
 <meta charset="UTF-8">
 <title>Title</title>
 <style>
 html, body {
            width: 100%;
 height: 100%;
 }
        #App {
            position: relative;
 width: 700px;
 height: 500px;
 }
    </style>
 <script crossorigin="anonymous"
 integrity="sha512-Nq+5zMfUurxmqy6GFT06Fw7nVSNZsXLtn0FrfXi6A9bUcbZZMgyKcNVrebRc7zV65tqKAO3ad+Ric9ZpAVaRDQ=="
 src="https://lib.baomitu.com/echarts/4.9.0-rc.1/echarts.js"></script>
</head>
<body>
<div id="App">
</div>
</body>
<script>
 let chart = echarts.init(document.getElementById('App'));
 var data =
        [[0, 0, 2.1, 4.74, -0.96, 'str1', 'M13', -2.52],
 [0, 1, 1.31, 1.71, -1.64, 'str1', 'M15', -4.35],
 [0, 2, -2.38, 2.92, -0.86, 'str1', 'M18', -3.58],
 [1, 0, 2.05, 0.19, 1.96, 'str1', 'M25', -2.54],
 [1, 1, 2.45, 5.28, 1.22, 'str2', 'M00', -2.62],
 [1, 2, -4.51, 0.62, 3.83, 'str2', 'M04', -1.23],
 [2, 0, 2.79, 0.98, -6.71, 'str2', 'M05', -3.51],
 [2, 1, 2.82, -3.07, -0.78, 'str2', 'M06', 2.18],
 [2, 2, -4.29, 3.86, 1.18, 'str2', 'M10', -2.84],
 [3, 0, -4.89, -0.98, -1.88, 'str2', 'M12', 1.36],
 [3, 1, -1.89, 3.79, 0.2, 'str2', 'M16', 1.44],
 [3, 2, 1.35, 5.92, 7.17, 'str2', 'M17', -0.32],
 [4, 0, 4.31, -0.03, 1.21, 'str2', 'M19', 3.04],
 [4, 1, -2.18, 2.0, -2.52, 'str2', 'M23', 0.66],
 [4, 2, -5.26, -2.53, -4.02, 'str2', 'M24', 2.26],
 [5, 0, -1.28, -0.85, 0.19, 'str2', 'M27', 5.99],
 [5, 1, -1.68, 1.0, 1.27, 'str3', 'M20', 1.62],
 [5, 2, -8.49, 0.13, -0.43, 'str3', 'M22', -1.29],
 [6, 0, -5.93, 6.5, 0.63, 'str3', 'M26', -3.94],
 [6, 1, -2.2, -0.2, 3.29, 'str4', 'M01', 3.64],
 [6, 2, 4.4, 0.64, 0.48, 'str4', 'M03', -3.9],
 [7, 0, -1.88, -3.41, 2.73, 'str4', 'M07', 0.99],
 [7, 1, -1.5, -1.45, 3.18, 'str4', 'M08', -7.22],
 [7, 2, 0.82, 1.52, -2.86, 'str4', 'M11', 0.34],
 [8, 0, 3.2, 1.72, 0.03, 'str4', 'M14', -5.66],
 [8, 1, 2.04, -5.02, -0.63, 'str4', 'M28', 1.6],
 [8, 2, 1.06, -1.03, 5.17, 'str4', 'M29', 1.23],
 [9, 0, 3.09, -6.73, -0.1, 'str5', 'M02', -0.89],
 [9, 1, -5.02, -1.63, 4.7, 'str5', 'M09', 0.26],
 [9, 2, 4.54, -1.41, -1.27, 'str5', 'M21', -5.0]];
 let itemSize = [0, 0]
    let option = {
        dataset: {
            dimensions: ['a', 'b', 'c', 'd', 'e', 'f', 'g', 'h'],
 source: data
        },
 tooltip: {},
 visualMap: [{
            show: false,
 min: -5,
 max: 5,
 dimension: 2,
 seriesIndex: 0,
 calculable: true,
 orient: 'horizontal',
 align: 'right',
 inRange: {
                color: ['#BAE7FF', '#1890FF', '#0050B3']
            },
 left: 'center'
 },
 {
                show: false,
 type: 'piecewise',
 categories: ['str1', 'str2', 'str3', 'str4', 'str5'],
 dimension: 5,
 innerWidth: 30,
 seriesIndex: 1,
 calculable: true,
 orient: 'horizontal',
 align: 'right',
 inRange: {
                    color: ['red', 'blue', '#000', 'yellow', 'green'],
 },
 left: 'center'
 }
        ],
 xAxis: [
            {
                name: 'x1',
 type: 'category',
 }
        ],
 yAxis: {
            type: 'category',
 },
 series: [
            {
                type: 'heatmap',
 encode: {
                    seriesName: [0, 1, 2]
                },
 label: {
                    show: true,
 },
 z: 3
 },
 {
                type: 'scatter',
 encode: {
                    seriesName: [5]
                },
 symbol: 'rect',
 symbolSize: [17, 17],
 symbolOffset: [0, 0],
 itemStyle: {
                    borderColor: '#fff',
 borderWidth: 2,
 },
 label: {
                    show: true,
 },
 z: 4
 },
 {
                type: 'custom',
 renderItem(params, api) {
                    itemSize = [api.size(0)[0] / 2 - 8, -api.size(0)[1] / 2 + 8];
 }
 //8是symbolSize的一半左右即可
            }
        ]
    }
    chart.setOption(option);
 //reset
 option.series[1].symbolOffset = itemSize;
 chart.setOption(option);
</script>
</html>

评论
登录后参与技术讨论,分享你的经验与见解。
登录 / 注册暂无评论