一、任务背景
某某某公司是一家电商网站,由于公司的业务快速发展,公司要求对现有机器进行业务监控,责成运维部门来实施这个项目。
任务要求
1)部署监控服务器,实现7x24实时监控
2)针对公司的业务及研发部门设计监控系统,对监控项和触发器拿出合理意见
3)做好问题预警机制,对可能出现的问题要及时告警并形成严格的处理机制
4)做好监控告警系统,要求可以实现告警分级
- 一级报警 电话通知
- 二级报警 微信通知
- 三级报警 邮件通知
5)处理好公司服务器异地集中监控问题,K8S内部使用的监控系统就是普罗米修斯
任务分析
为什么要监控?
答: 实时收集数据,通过报警及时发现问题,及时处理。数据为优化也可以提供依据。
监控四要素:
监控对象 [主机状态 服务 资源 页面,url]
用什么监控 [zabbix-server zabbix-agent] => 普罗米修斯监控
什么时间监控 [7x24 5x8]
报警给谁 [管理员]
项目选型:
- mrtg (Multi Router Traffic Grapher)通过snmp协议得到设备的流量信息,并以包含PNG格式的图形的HTML文档方式显示给用户。
- cacti (仙人掌) 用php语言实现的一个软件,它的主要功能是用snmp服务获取数据,然后用rrdtool储存和更新数据。官网地址: https://www.cacti.net/
- ntop 官网地址: https://www.ntop.org/
- nagios 能够跨平台,插件多,报警功能强大。官网地址: https://www.nagios.org/
- centreon 底层使用的就是nagios。是一个nagios整合版软件。官网地址:https://www.centreon.com/
- ganglia 设计用于测量数以千计的节点,资源消耗非常小。官网地址:http://ganglia.info/
- open-falcon 小米发布的运维监控软件,高效率,高可用。时间较短,用户基数小。官网地址: http://open-falcon.org/
- zabbix 跨平台,画图,多条件告警,多种API接口。使用基数特别大。官网地址: https://www.zabbix.com/
- prometheus 基于时间序列的数值数据的容器监控解决方案。官网地址: https://prometheus.io/
综合分析:Prometheus比较适合公司的监控需求
二、普罗米修斯概述
Prometheus是最初在SoundCloud上构建的开源系统监视和警报工具包 。自2012年成立以来,许多公司和组织都采用了Prometheus,该项目拥有非常活跃的开发人员和用户社区。现在,它是一个独立的开源项目,并且独立于任何公司进行维护。为了强调这一点并阐明项目的治理结构,Prometheus 于2016年加入了 Cloud Native Computing Foundation,这是继Kubernetes之后的第二个托管项目。
Prometheus 的优点
- 非常少的外部依赖,安装使用超简单
- 已经有非常多的系统集成 例如:docker HAProxy Nginx JMX等等
- 服务自动化发现
- 直接集成到代码
- 设计思想是按照分布式、微服务架构来实现的
Prometheus 的特性
- 一个多维数据模型,其中包含通过度量标准名称和键/值对标识的时间序列数据
- PromQL,一种灵活的查询语言 ,可利用此维度
- 不依赖分布式存储;单服务器节点是自治的
- 时间序列收集通过HTTP上的拉模型进行
- 通过中间网关支持推送时间序列
- 通过服务发现或静态配置发现目标
- 多种图形和仪表板支持模式
组件
Prometheus生态系统包含多个组件,其中许多是可选的:
- Prometheus server ,它会抓取并存储时间序列数据
- client libraries,用于检测应用程序代码
- push gateway,一个支持短期工作的推送网关
- 诸如HAProxy,StatsD,Graphite等服务的专用输出端
- 一个alertmanager处理警报
- 各种支持工具
- the main Prometheus server which scrapes and stores time series data
- client libraries for instrumenting application code
- a push gateway for supporting short-lived jobs
- special-purpose exporters for services like HAProxy, StatsD, Graphite, etc.
- an alertmanager to handle alerts
- various support tools
大多数Prometheus组件都是用Go编写的,因此易于构建和部署为静态二进制文件。
Prometheus原理架构图
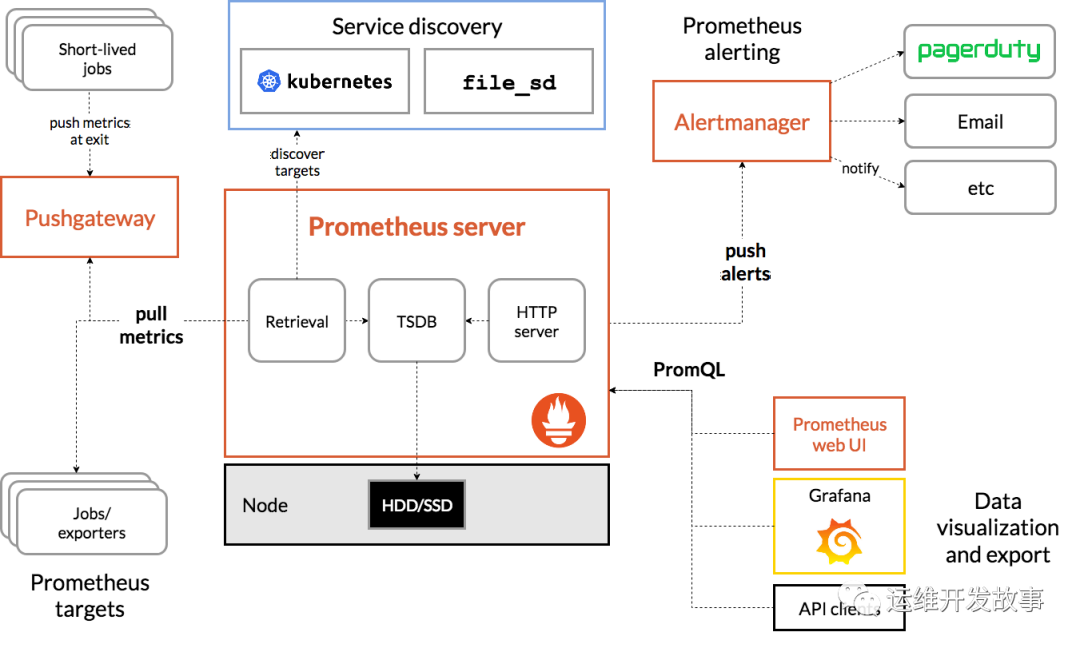
下图说明了Prometheus的体系结构及其某些生态系统组件:
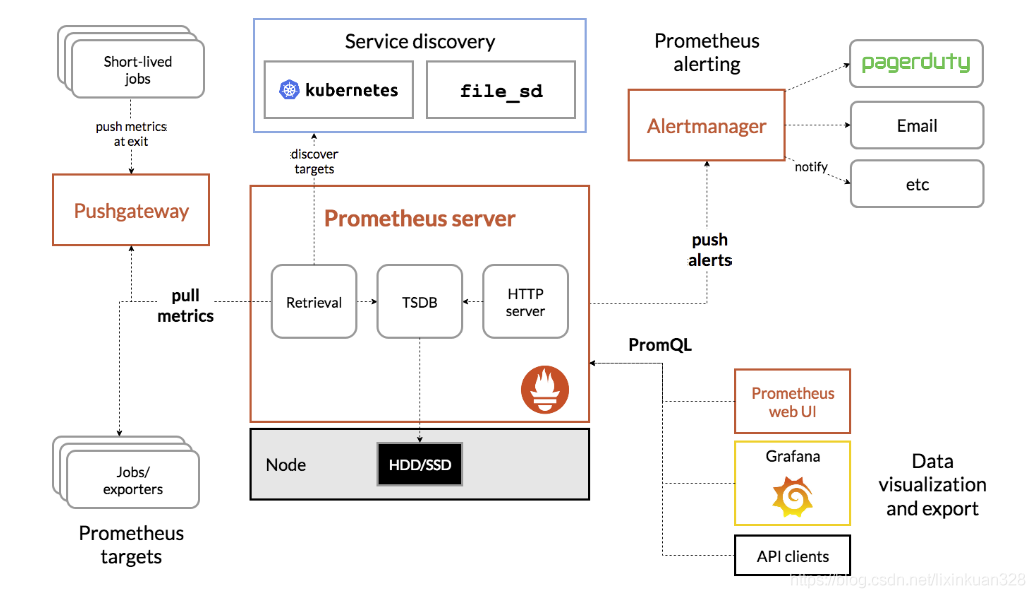
Prometheus直接或通过中介推送网关从已检测作业中删除指标,以处理短暂的作业。它在本地存储所有报废的样本,并对这些数据运行规则,以汇总和记录现有数据中的新时间序列,或生成警报。Grafana或其他API使用者可以用来可视化收集的数据。
什么时候适合?
Prometheus可以很好地记录任何纯数字时间序列。它既适用于以机器为中心的监视,也适用于高度动态的面向服务的体系结构的监视。在微服务世界中,它对多维数据收集和查询的支持是一种特别的优势。
Prometheus的设计旨在提高可靠性,使其成为中断期间要使用的系统,以使您能够快速诊断问题。每个Prometheus服务器都是独立的,而不依赖于网络存储或其他远程服务。当基础结构的其他部分损坏时,您可以依靠它,并且无需设置广泛的基础结构即可使用它。
什么时候不适合?
普罗米修斯重视可靠性。即使在故障情况下,您始终可以查看有关系统的可用统计信息。如果您需要100%的准确性(例如按请求计费),则Prometheus并不是一个好的选择,因为所收集的数据可能不够详细和完整。在这种情况下,最好使用其他系统来收集和分析数据以进行计费,并使用Prometheus进行其余的监视。
三、安装prometheus
3.1、实验环境准备
服务器 IP地址:
- Prometneus服务器: 192.168.211.101
- 被监控服务器: 192.168.211.102
- grafana服务器:192.168.211.103
静态ip(要求能上外网)
主机名:
各自配置好主机名
# hostnamectl set-hostname --static server.cluster.com
三台都互相绑定IP与主机名
# vim /etc/hosts
192.168.211.101 server.cluster.com
192.168.211.102 agent1.cluster.com
192.168.211.103 grafana.cluster.com
时间同步(时间同步一定要确认一下)
yum install -y ntpdate && ntpdate time.windows.com
关闭防火墙,selinux
systemctl status firewalld
# systemctl stop firewalld
# systemctl disable firewalld
# iptables -F
3.2、解压安装
从 https://prometheus.io/download/ 下载相应版本,安装到服务器上。官网提供的是二进制版,解压就能用,不需要编译
上传prometheus-2.5.0.linux-amd64.tar.gz
[root@server sortware]# tar -zxvf prometheus-2.5.0.linux-amd64.tar.gz -C /opt/data/
tar -zxvf prometheus-2.5.0.linux-amd64.tar.gz -C /usr/local/
mv /usr/local/prometheus-2.5.0.linux-amd64/  /usr/local/prometheus
直接使用默认配置文件启动
/usr/local/prometheus/prometheus --config.file="/usr/local/prometheus/prometheus.yml" & [root@server prometheus-2.5.0.linux-amd64]# ./prometheus --help
usage: prometheus [] The Prometheus monitoring server
Flags:
-h, --help Show context-sensitive help (also try --help-long and --help-man).
--version Show application version.
--config.file="prometheus.yml"
Prometheus configuration file path.
--web.listen-address="0.0.0.0:9090"
Address to listen on for UI, API, and telemetry.
--web.read-timeout=5m Maximum duration before timing out read of the request, and closing idle connections.
--web.max-connections=512 Maximum number of simultaneous connections.
--web.external-url=The URL under which Prometheus is externally reachable (for example, if Prometheus is served via a reverse proxy). Used
for generating relative and absolute links back to Prometheus itself. If the URL has a path portion, it will be used to
prefix all HTTP endpoints served by Prometheus. If omitted, relevant URL components will be derived automatically.
--web.route-prefix=Prefix for the internal routes of web endpoints. Defaults to path of --web.external-url.
--web.user-assets=Path to static asset directory, available at /user.
--web.enable-lifecycle Enable shutdown and reload via HTTP request.
--web.enable-admin-api Enable API endpoints for admin control actions.
--web.console.templates="consoles"
Path to the console template directory, available at /consoles.
--web.console.libraries="console_libraries"
Path to the console library directory.
--storage.tsdb.path="data/"
Base path for metrics storage.
--storage.tsdb.retention=15d
How long to retain samples in storage.
--storage.tsdb.no-lockfile
Do not create lockfile in data directory.
--storage.remote.flush-deadline=
How long to wait flushing sample on shutdown or config reload.
--storage.remote.read-sample-limit=5e7
Maximum overall number of samples to return via the remote read interface, in a single query. 0 means no limit.
--storage.remote.read-concurrent-limit=10
Maximum number of concurrent remote read calls. 0 means no limit.
--rules.alert.for-outage-tolerance=1h
Max time to tolerate prometheus outage for restoring 'for' state of alert.
--rules.alert.for-grace-period=10m
Minimum duration between alert and restored 'for' state. This is maintained only for alerts with configured 'for' time
greater than grace period.
--rules.alert.resend-delay=1m
Minimum amount of time to wait before resending an alert to Alertmanager.
--alertmanager.notification-queue-capacity=10000
The capacity of the queue for pending Alertmanager notifications.
--alertmanager.timeout=10s
Timeout for sending alerts to Alertmanager.
--query.lookback-delta=5m The delta difference allowed for retrieving metrics during expression evaluations.
--query.timeout=2m Maximum time a query may take before being aborted.
--query.max-concurrency=20
Maximum number of queries executed concurrently.
--query.max-samples=50000000
Maximum number of samples a single query can load into memory. Note that queries will fail if they would load more samples
than this into memory, so this also limits the number of samples a query can return.
--log.level=info Only log messages with the given severity or above. One of: [debug, info, warn, error]
确认端口(9090):ss -anltp | grep 9090

3.3、prometheus界面
通过浏览器访问:http://192.168.211.101:9090/targets 就可以访问到prometheus的主界面
默认只监控了本机一台,点Status --》点Targets --》可以看到只监控了本 机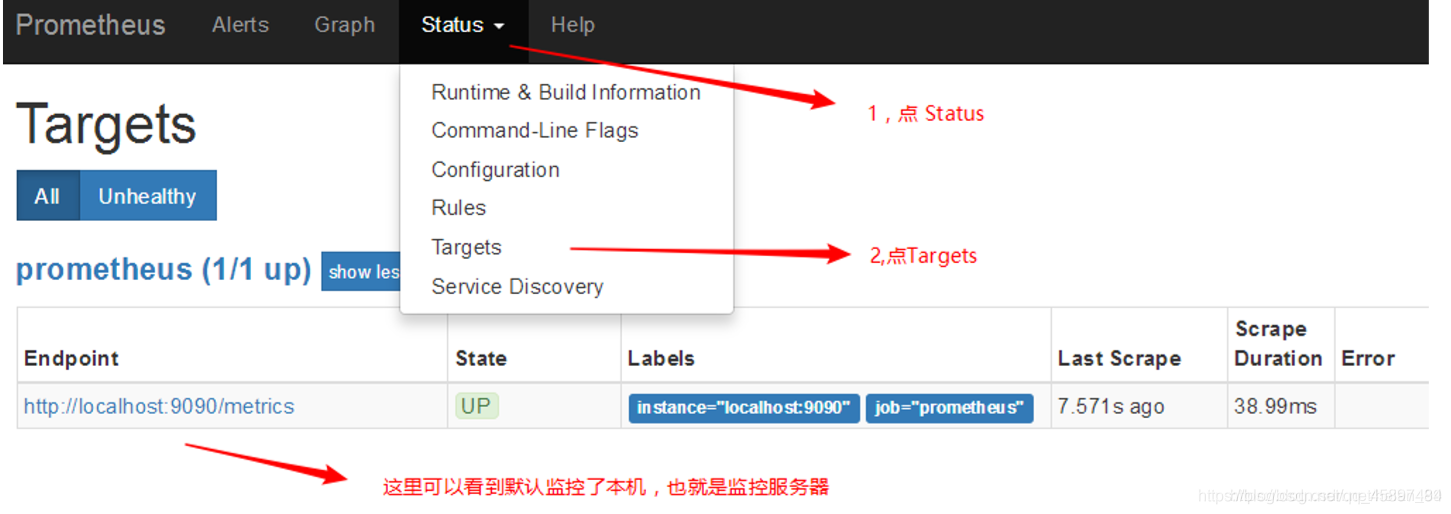
主机数据展示:http://192.168.211.101:9090/metrics 可以查看到监控的数据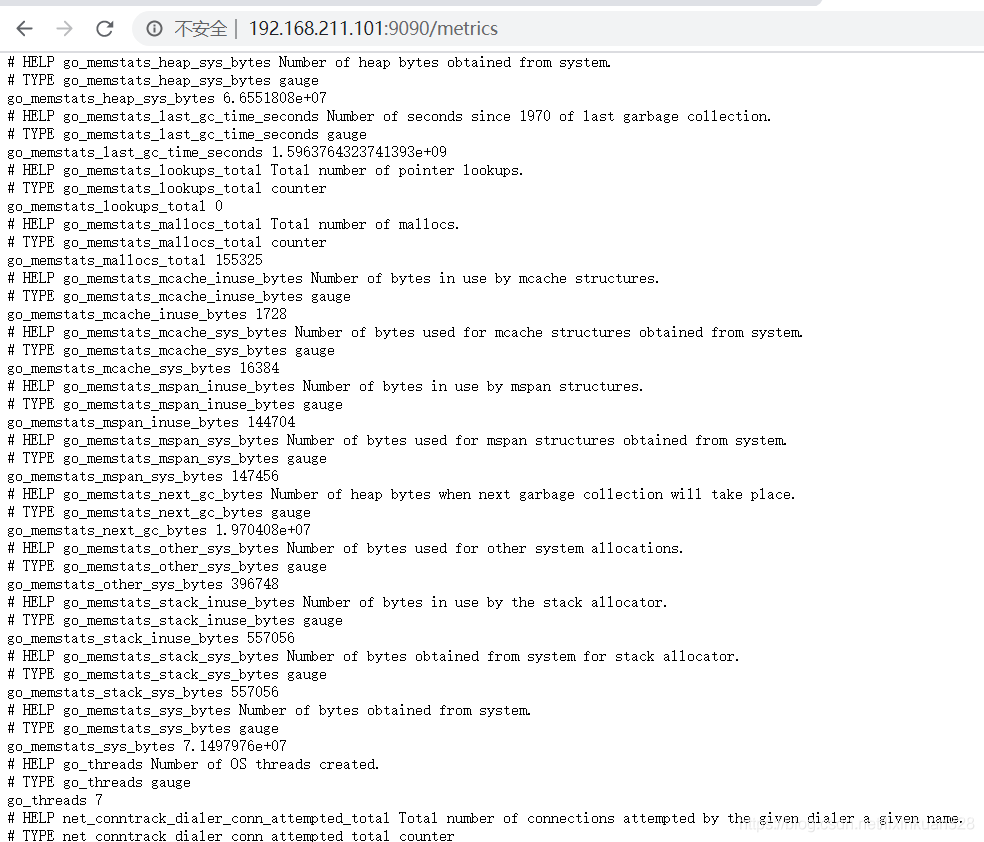
在web主界面可以通过关键字查询监控项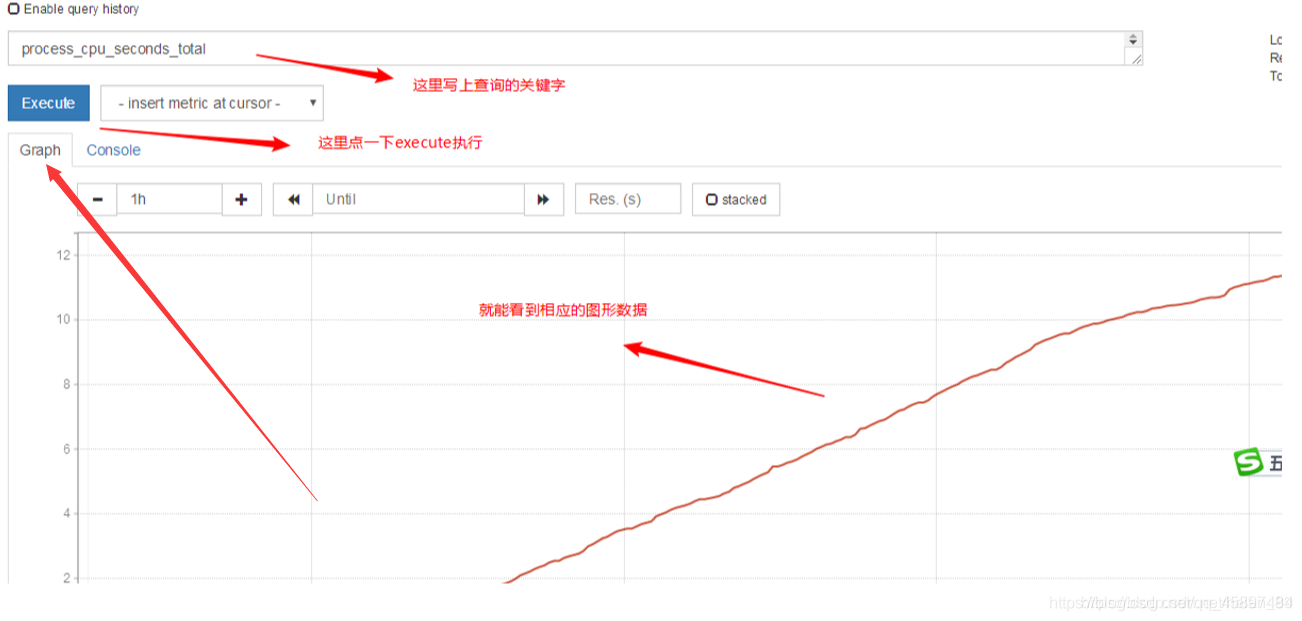
4、监控远程Linux主机
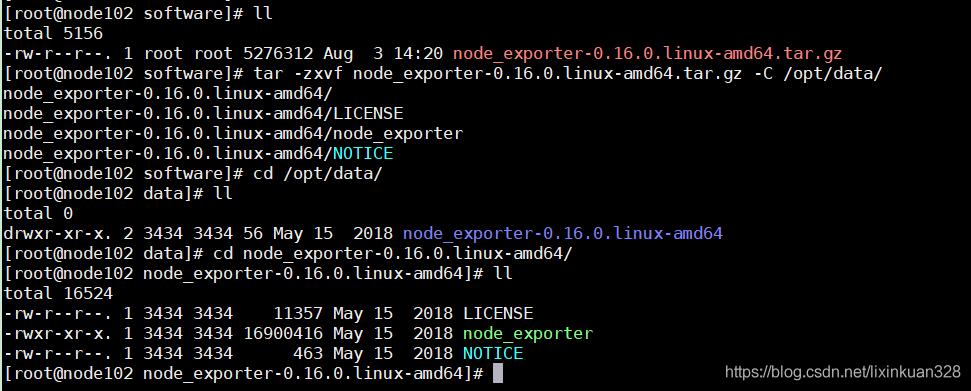
① 在远程linux主机(被监控端agent1)上安装node_exporter组件,下载地址: https://prometheus.io/download/
上传node_exporter-0.16.0.linux-amd64.tar.gz
[root@node102 software]# tar -zxvf node_exporter-0.16.0.linux-amd64.tar.gz -C /opt/data/
tar -zxvf node_exporter-0.16.0.linux-amd64.tar.gz -C /usr/local/
mv /usr/local/node_exporter-0.16.0.linux-amd64/ /usr/local/node_exporter 里面就一个启动命令node_exporter,可以直接使用此命令启动
nohup /opt/data/node_exporter-0.16.0.linux-amd64/node_exporter &
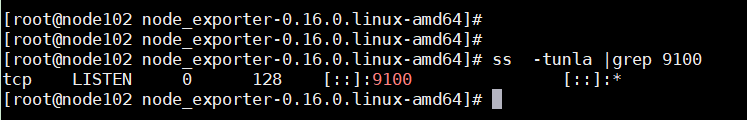
确认端口(9100)
扩展: nohup命令: 如果把启动node_exporter的终端给关闭,那么进程也会 随之关闭。nohup命令会帮你解决这个问题。
② 通过浏览器访问 http://192.168.211.102:9100/metrics 就可以查看到 node_exporter在被监控端收集的监控信息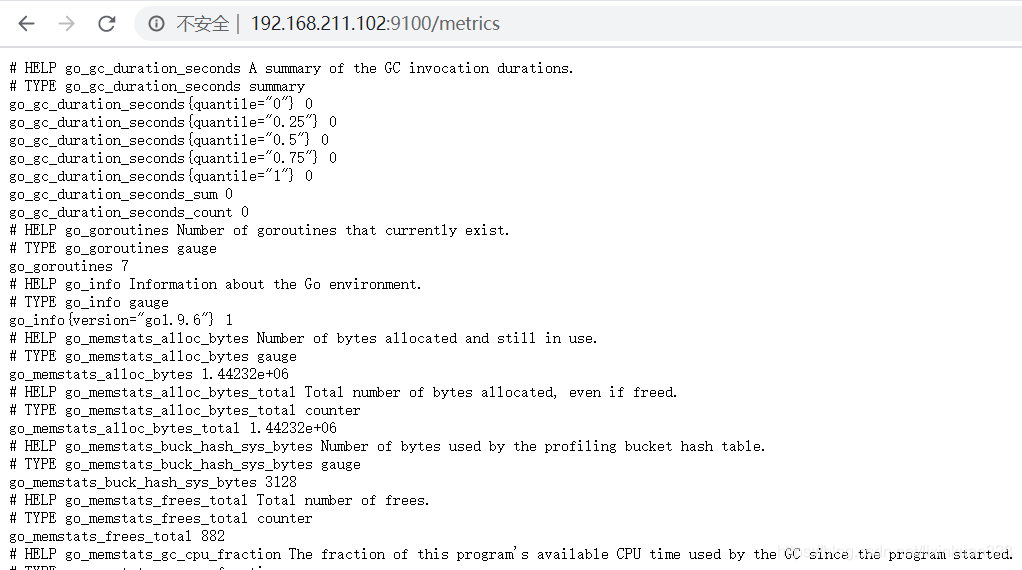
③ 回到prometheus服务器的配置文件里添加被监控机器的配置段
在主配置文件最后加上下面三行
vim /usr/local/prometheus/prometheus.yml
- job_name: 'node102'
static_configs:
- targets: ['192.168.209.128:9100']
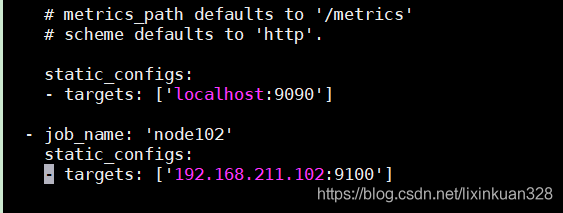
- job_name: ‘node102’ # 取一个job名称来代 表被监控的机器
static_configs:- targets: [‘192.168.209.128:9100’] # 这里改成被监控机器 的IP,后面端口接9100
改完配置文件后,重启服务:
pkill prometheus
确认端口没有进程占用
./prometheus --config.file="./prometheus.yml" &
确认端口被占用,说 明重启成功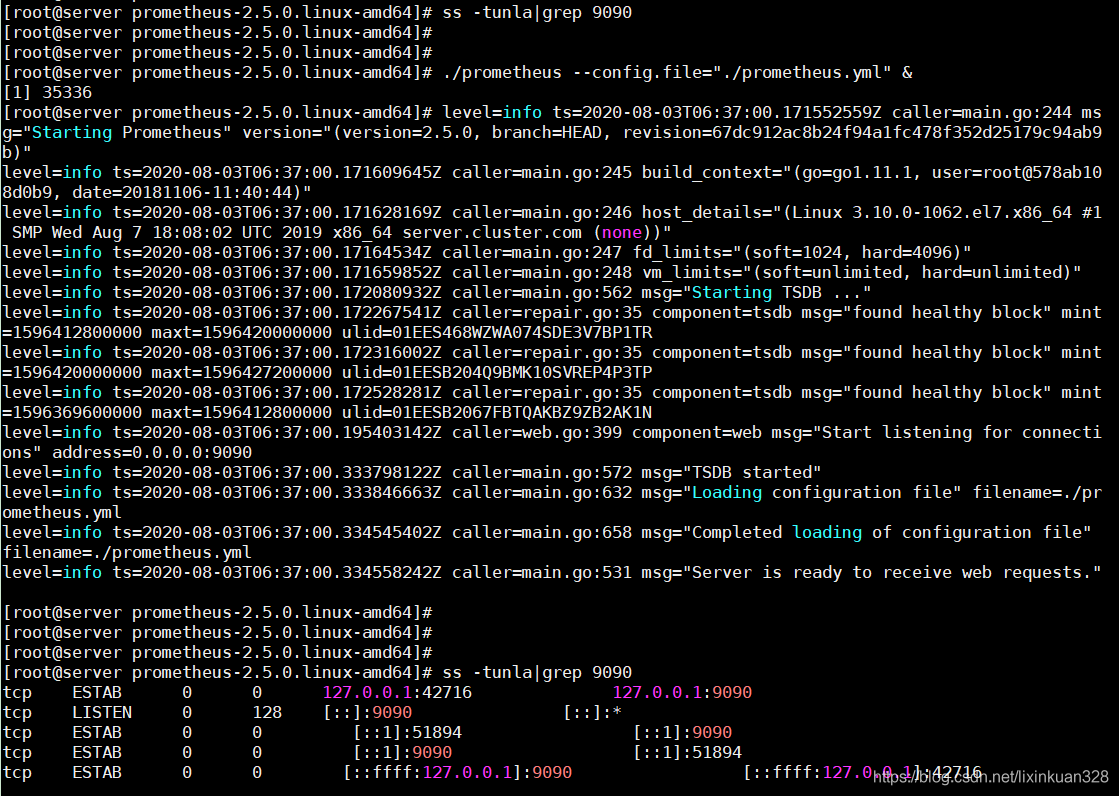
④ 回到web管理界面 --》点Status --》点Targets --》可以看到多了一台监 控目标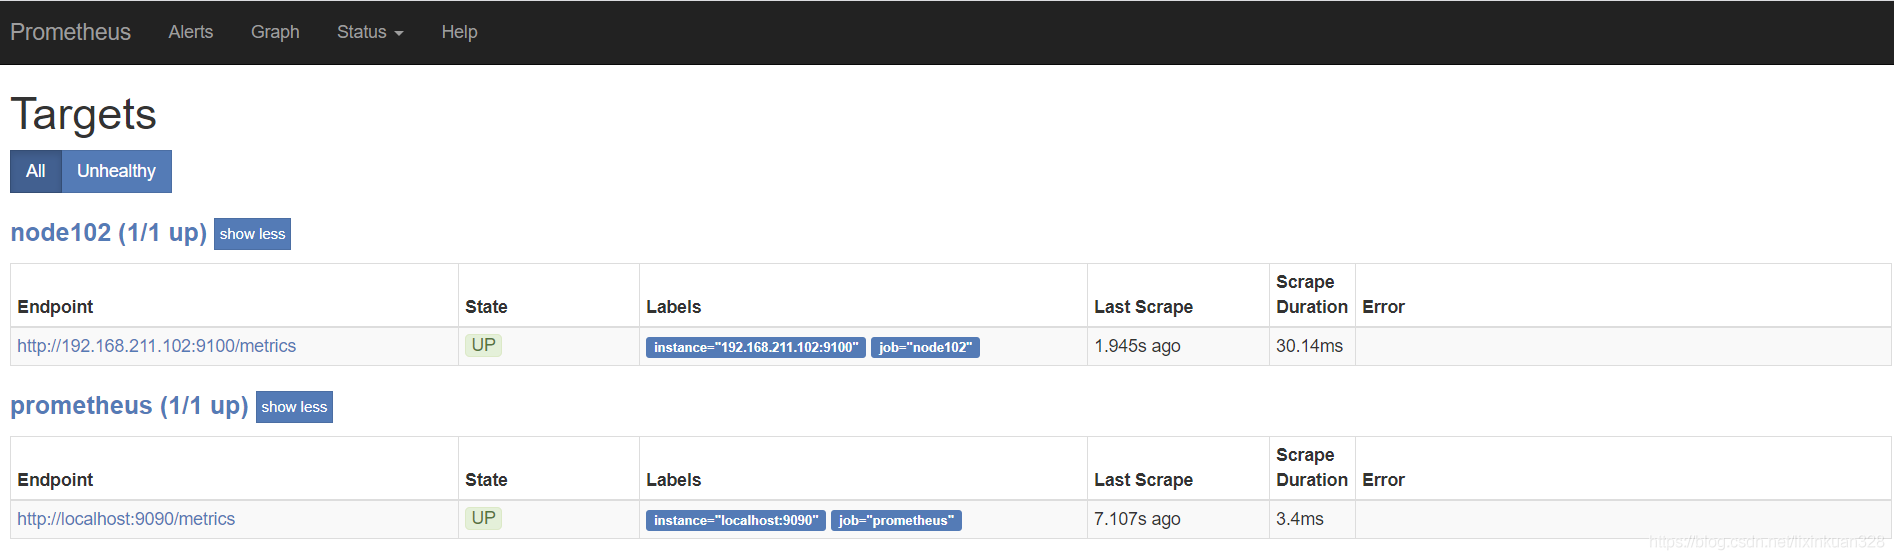
本文转自 https://blog.csdn.net/lixinkuan328/article/details/107744002,如有侵权,请联系删除。