matplotlib绘图(3)

LogicPulseMaster
• 阅读 2470
文章中我们学习的主要技能有:移动坐标轴,显示图例,显示标记等。

1 移动坐标轴

import matplotlib.pyplot as plt
import numpy as np

# 设置图形的长宽比例
plt.figure(figsize=(14,6))
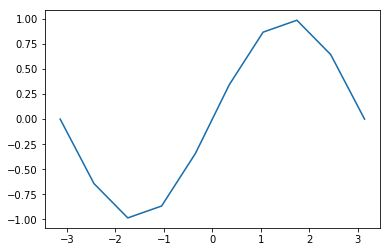
# 绘制sin曲线
plt.subplot(121)
x = np.linspace(-np.pi, np.pi, 500, endpoint=True)
y = np.sin(x)
plt.plot(x, y)

plt.subplot(122)
plt.plot(x, y)
# 得到坐标轴
ax = plt.gca()
# 获取右边和上边设置颜色为none
ax.spines['right'].set_color('none')
ax.spines['top'].set_color('none')
# 移动坐标轴
ax.spines['bottom'].set_position(('data', 0))
ax.spines['left'].set_position(('data', 0))

ax.xaxis.set_ticks_position('bottom')
ax.yaxis.set_ticks_position('left')

plt.show()

matplotlib绘图(3)

2 显示图例

from matplotlib.pyplot import *
import numpy as np

x = np.linspace(-np.pi, np.pi, 500, endpoint=True)
y = np.sin(x)
y0=np.cos(x)

plot(x, y,label='sin')
plot(x, y0,label='cos')

# 显示标题
title('$\sin$'+' & '+'$\cos$')

# 设置图例 loc 位置   ncol一行显示多少列   borderaxespad 坐标轴与图例之间的距离
# bbox_to_anchor指定图例的起始位置 参数为起始点 (整个坐标轴的高度为1)
legend(bbox_to_anchor=(0.,1.02), loc=3, mode='expend', ncol=2, borderaxespad=0.)

# 第一个参数 要显示的文字 指向的坐标  xycoords ='data' 和数据使用相同的坐标系  xytext 文字的坐标 arrowprops 箭头的样式
annotate('max sin(x)', (1.5, 1), xycoords='data', xytext=(2.88, 0.95), arrowprops=dict(arrowstyle='<-'))
annotate('max cos(x)', (0, 1), xycoords='data', xytext=(-2.5, 0.7), arrowprops=dict(arrowstyle='<-'))

show()

matplotlib绘图(3)

3 显示标记

from pylab import *
import numpy as np
# 得到图形
fig=figure()
# 得到现在的坐标轴
ax=gca()

start=datetime.datetime(2013,1,1)
end=datetime.datetime(2013,12,31)

delta=datetime.timedelta(days=1)
# 得到所有的日期
dates=mpl.dates.drange(start,end,delta)
# 生成指定数量的0-1的随机数
values=np.random.rand(len(dates))
# 标记marker mfc标记的中心颜色  mec 标记的边缘颜色
ax.plot(dates,values,linestyle='-',marker='v',mfc='r',mec='g')

date_format=mpl.dates.DateFormatter('%Y-%m-%d')
# 设置x轴的主要格式为日期格式
ax.xaxis.set_major_formatter(date_format)

# 自动排版合适的方式位置显示x轴的时间
fig.autofmt_xdate()


show()

matplotlib绘图(3)

点赞
收藏
评论区
推荐文章
Irene181 Irene181
4年前
数据可视化干货:使用pandas和seaborn制作炫酷图表
吾日三省吾身:为人谋而不忠乎?与朋友交而不信乎?传不习乎?导读:我们介绍过用matplotlib制作图表的一些tips,感兴趣的同学可以戳→。matplotlib是一个相当底层的工具。你可以从其基本组件中组装一个图表:数据显示(即绘图的类型:线、条、框、散点图、轮廓等)、图例、标题、刻度标记和其他注释。在pandas中,我们可能有多个数据列,并且带有行
凯特林 凯特林
4年前
移动端H5开发常用技巧总结
html篇常用的meta属性设置meta对于移动端的一些特殊属性,可根据需要自行设置<meta name"screenorientation" content"portrait" //Android 禁止屏幕旋转<meta name"fullscreen" content"yes"             //全屏显示
CuterCorley CuterCorley
4年前
Python matplotlab库使用方法及注意事项
1.Python使用Matplotlib模块时坐标轴标题中文及各种特殊符号显示方法pythonimportmatplotlib.pyplotasplttarange(4pi,4pi,0.01)ysin(t)/tplt.plot(t,y)plt.title('www.jb51.nettest')plt.xlabe
虾米大王 虾米大王
3年前
java代码080
code080.jsp显示图书列表所有图书信息ID图书名称价格数量作者<%Listlist1(List)request.getAttribute("list");if(list1null||list1.size()<inputtype"hidden"nam
虾米大王 虾米大王
3年前
java代码031
code032.jsp显示结果显示结果你的名字:你喜欢去的地方:
Stella981 Stella981
3年前
ActiViz(VTK的C#库)学习使用心得之九:三维坐标轴的实现
    三维程序设计中,通常会在控件窗口中设置和显示坐标轴系线,方便操作和使用。VTY库中提供vtkAxesActor类,方便用户快捷实现三维坐标的实现。效果如下:!(https://oscimg.oschina.net/oscnet/74ce39b3acd40fca584e7d0df565693d3ef.jpg)    C核心代
Stella981 Stella981
3年前
H5中canvas和svg绘图方式介绍
在HTML5中包括了两种绘图方式,canvas和svg(矢量呈现),而与canvas不同的是,svg是一种XML标记语言,它既可以单独保存以“.svg”为后缀的文件在浏览器中打开显示,也支持建立svg标签直接嵌入在网页中显示,还可以通过<embedsrc"文件.svg"name"name自命"type"image/svgxml"height
Stella981 Stella981
3年前
Django之Django模板
1、问:html页面从数据库中读出DateTimeField字段时,显示的时间格式和数据库中存放的格式不一致,比如数据库字段内容为2012082616:00:00,但是页面显示的却是Aug.26,2012,4p.m.答:为了页面和数据库中显示一致,需要在页面格式化时间,需要添加<td{{dayrecord.p\_time|date:
Stella981 Stella981
3年前
Django中Admin中的一些参数配置
设置在列表中显示的字段,id为django模型默认的主键list_display('id','name','sex','profession','email','qq','phone','status','create_time')设置在列表可编辑字段list_editable
Stella981 Stella981
3年前
Graphviz图片显示中文乱码问题
1\.报错详情¶现象:graph.view()展示的图形显示中文为乱码。In \40\:fromsklearnimporttreefromsklearn.datasetsimportload_winefromsklearn.model_selectionimporttrain
Stella981 Stella981
3年前
PowerDesigner列名、注释内容互换
在用PowerDesigner时,常常在NAME或Comment中写中文在Code中写英文,Name只会显示给我们看,Code会使用在代码中,但Comment中的文字会保存到数据库TABLE的Description中,有时候我们写好了Name再写一次Comment很麻烦,以下两段代码就可以解决这个问题。在PowerDesigner中PowerDesig