推荐
专栏
教程
课程
飞鹅
本次共找到22条
grafana
相关的信息
GoCoding
•
4年前
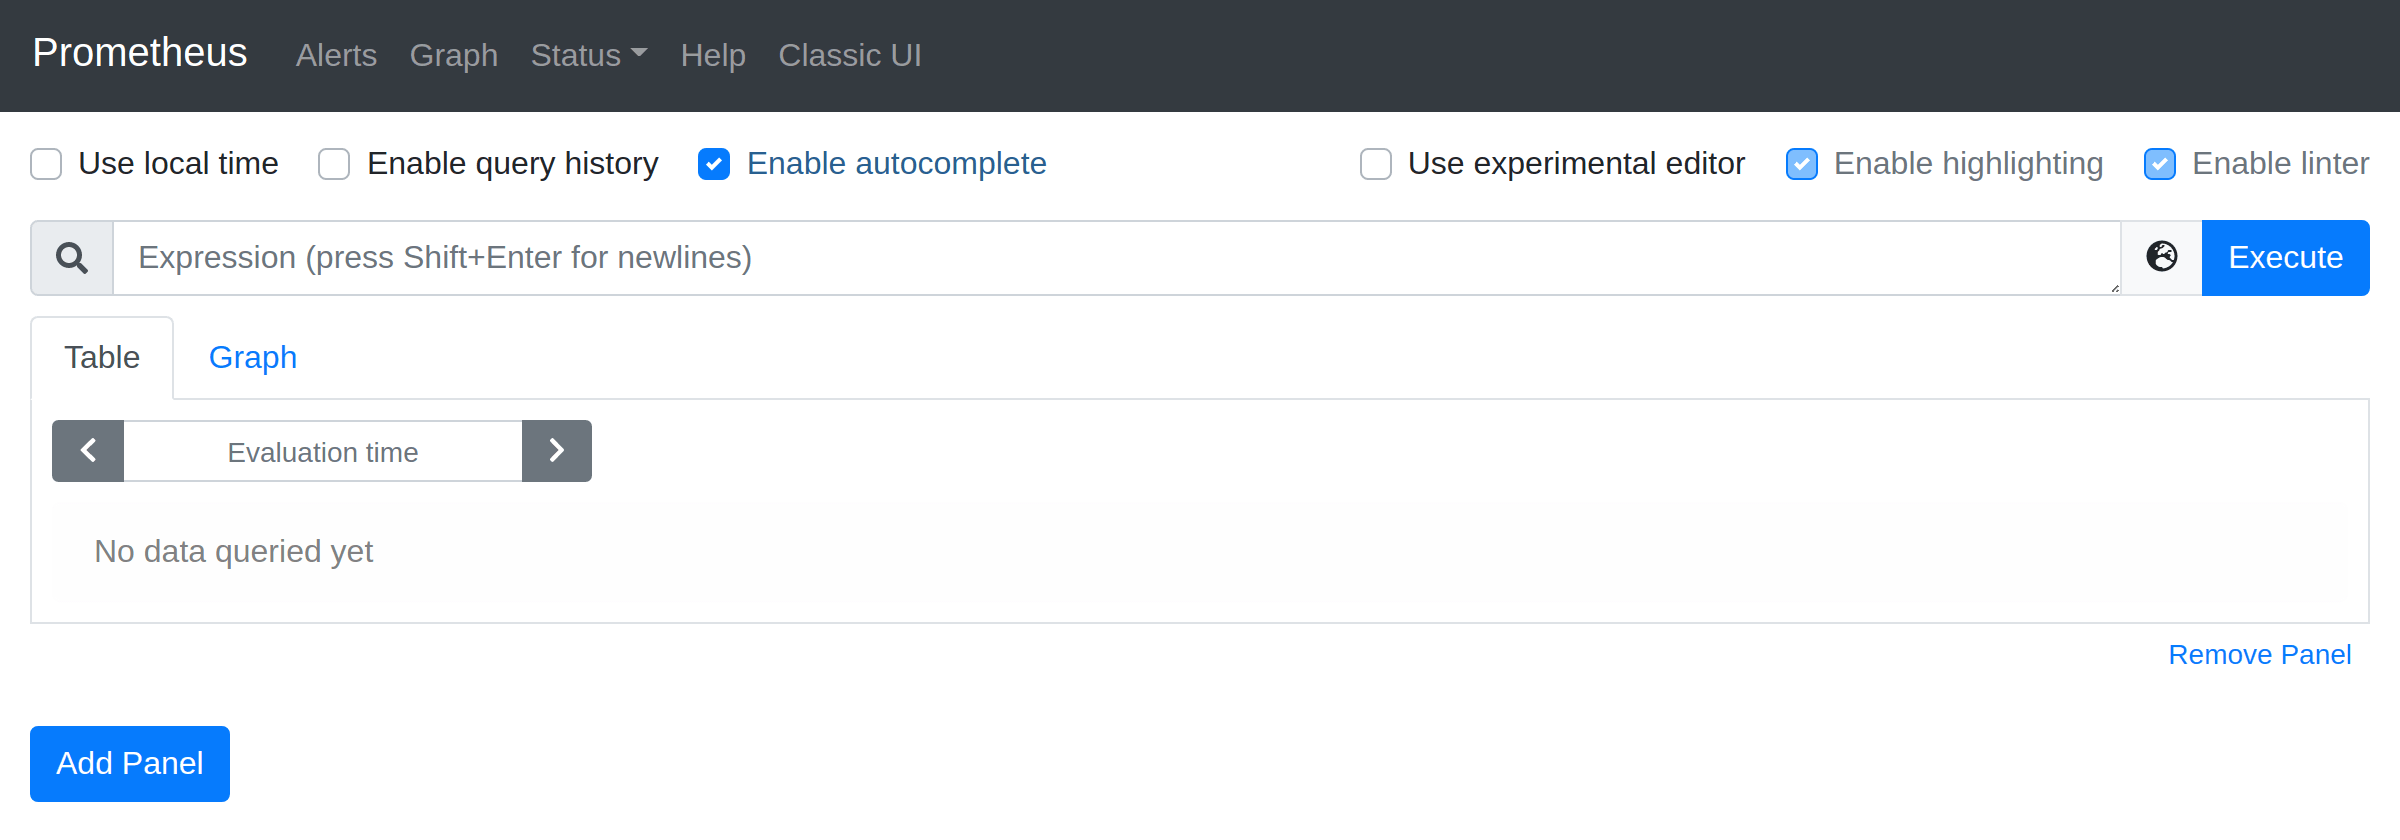
Prometheus + Grafana 快速上手
快速上手,监控主机的CPU,GPU,MEM,IO等状态。前提客户端NodeExporter用于采集UNIX内核主机的数据,并解压:bashwgethttps://github.com/prometheus/nodeexporter/releases/download/v1.1.2/nodeexporter1.1.2.linux
Johnny21
•
4年前
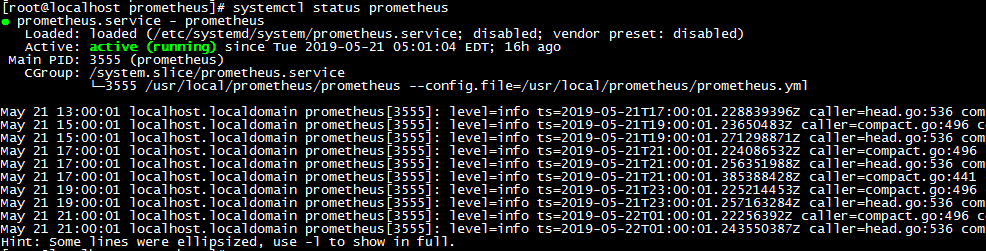
Promtheus实战系列(一)之环境部署与搭建
一、部署prometheus,grafana和node\_exporterPrometheus开始教程:1.1环境(centos7)root@localhostprometheusunameaLinuxlocalhost.localdomain3.10
Wesley13
•
4年前
4.Grafana展示监控数据
Grafana是什么?我们知道Node\_export监控服务器状态,但是没有具体的展示,简单来说,Grafana的主要作用就是对监控的数据进行图形化展示。docker部署grafana我们这里采用docker方式部署,Docker安装,可参考Centos7下实现dockerwordpress安装(https://
Stella981
•
4年前
Prometheus 与 Grafana 集成
文章首发于公众号《程序员果果》地址:https://mp.weixin.qq.com/s/GImvM\_F2XlMjO0a5xnJuFg(https://www.oschina.net/action/GoToLink?urlhttps%3A%2F%2Fmp.weixin.qq.com%2Fs%2FGImvM_F2XlMjO0a5xnJuFg)
Stella981
•
4年前
Prometheus + Grafana +Alertmanager监控报警k8s集群
prometheus监控k8s集群具体版本Prometheus:v2.2.1kubernetes:v1.18.9Grafana:latestalertmanager:v0.14.0metrics:v1.3.0
Stella981
•
4年前
Grafana + Prometheus 监控PostgreSQL
效果图!(https://img2018.cnblogs.com/blog/1178572/201905/117857220190526141011952929637180.png)部署环境服务器名称IP地址监控指标部署agent备注shtsgmhadoopcm01172.16.101.54OSnod
Stella981
•
4年前
Grafana分析Nginx日志
按日期对ES的index进行分割:logstash配置:input{file{path"/home/hottopic/logs/trendshottingapi/metric/"type"trendshottingapimetric"start_p
Stella981
•
4年前
Prometheus & Grafana 初探
拿到一个新需求,通过Prometheus&Grafana监控接口。有点晚了,长话短说,早点回家。整合Prometheus到go项目中可以参考官方示例(https://www.oschina.net/action/GoToLink?urlhttps%3A%2F%2Fgithub.com%2Fprometheus%2Fc
Stella981
•
4年前
Prometheus——可视化Grafana
官方地址https://grafana.com/grafana/(https://www.oschina.net/action/GoToLink?urlhttps%3A%2F%2Fgrafana.com%2Fgrafana%2F)安装官方下载地址https://grafana.com/grafana/download(http
天翼云开发者社区
•
5个月前
Grafana无法启动修复解决
某项目的Grafana服务因Mysql漏洞修复导致无法正常启动,当天巡检人员在尝试一些方法后,问题依然存在。在了解了事情的背景后,……
1
2
3