公众号关注 “ 杰哥的IT之旅 ”,
选择“ 星标 ”, 重磅干货,第一 时间送达!
来自:FreeBuf.COM
作者:secist
=====================================================================================================
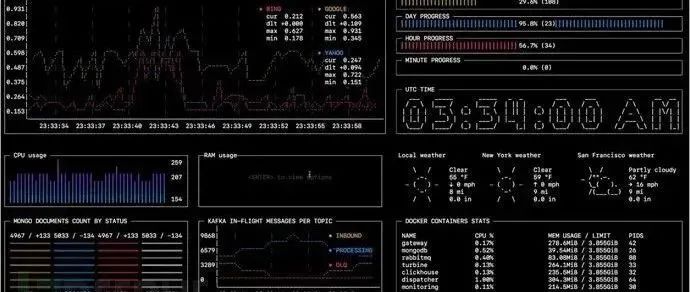
Sampler是一个用于shell命令执行,可视化和告警的工具。其配置使用的是一个简单的YAML文件。
1、为什么我需要它?
你可以直接从终端对任意动态进程进行采样 – 观察数据库中的更改,监控MQ动态消息(in-flight messages),触发部署脚本并在完成后获取通知。
如果有一种方法可以使用shell命令获取指标(metric),那么可以使用Sampler立即对其进行可视化。
2、安装
macOS
brew cask install sampler
或
sudo curl -Lo /usr/local/bin/sampler https://github.com/sqshq/sampler/releases/download/v1.0.3/sampler-1.0.3-darwin-amd64sudo chmod +x /usr/local/bin/sampler
Linux
sudo wget https://github.com/sqshq/sampler/releases/download/v1.0.3/sampler-1.0.3-linux-amd64 -O /usr/local/bin/samplersudo chmod +x /usr/local/bin/sampler
注意:需要为Sampler安装libasound2-dev系统库用以播放触发器声音。通常库已安装在相应位置,但如果没有 – 你可以使用你习惯的包管理器进行安装,例如apt install libasound2-dev
Windows(实验)
建议在高级控制台模拟器下使用,如Cmder
Download .exe
3、使用
指定shell命令,Sampler会相应的速率执行这些命令。输出用于可视化。
使用Sampler基本上的三步过程:
在YAML配置文件中定义shell命令
运行sampler -c config.yml
在UI上调整组件大小和位置
市面早已有许多监控系统
Sampler绝不是监控系统的替代品,而是易于设置的开发工具。
如果spinning up和使用Grafana配置Prometheus是完全多余的任务,那么Sampler可能是正确的解决方案。没有服务器,没有数据库,不需要部署 – 你指定了shell命令,它就可以工作了。
我监控的每台服务器上都需要安装吗?
不,你可以在本地运行Sampler,但仍然可以从多台远程计算机上收集遥测数据。任何可视化都可能具有init命令,你可以在其中ssh到远程服务器。请参阅SSH example
4、组件
以下是每种组件类型的配置示例列表,其中包含与macOS兼容的采样脚本。
Runchart
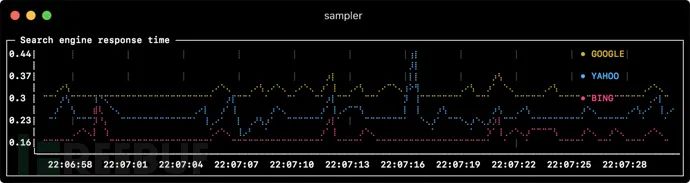
runcharts: - title: Search engine response time rate-ms: 500 # sampling rate, default = 1000 scale: 2 # number of digits after sample decimal point, default = 1 legend: enabled: true # enables item labels, default = true details: false # enables item statistics: cur/min/max/dlt values, default = true items: - label: GOOGLE sample: curl -o /dev/null -s -w '%{time_total}' https://www.google.com color: 178 # 8-bit color number, default one is chosen from a pre-defined palette - label: YAHOO sample: curl -o /dev/null -s -w '%{time_total}' https://search.yahoo.com - label: BING sample: curl -o /dev/null -s -w '%{time_total}' https://www.bing.com
Sparkline
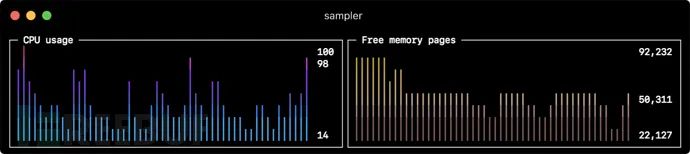
sparklines: - title: CPU usage rate-ms: 200 scale: 0 sample: ps -A -o %cpu | awk '{s+=$1} END {print s}' - title: Free memory pages rate-ms: 200 scale: 0 sample: memory_pressure | grep 'Pages free' | awk '{print $3}'
Barchart
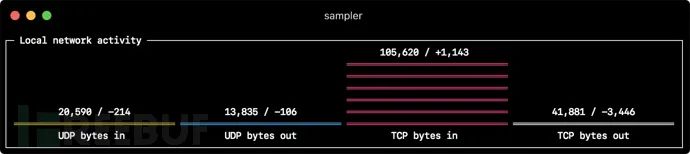
barcharts: - title: Local network activity rate-ms: 500 # sampling rate, default = 1000 scale: 0 # number of digits after sample decimal point, default = 1 items: - label: UDP bytes in sample: nettop -J bytes_in -l 1 -m udp | awk '{sum += $4} END {print sum}' - label: UDP bytes out sample: nettop -J bytes_out -l 1 -m udp | awk '{sum += $4} END {print sum}' - label: TCP bytes in sample: nettop -J bytes_in -l 1 -m tcp | awk '{sum += $4} END {print sum}' - label: TCP bytes out sample: nettop -J bytes_out -l 1 -m tcp | awk '{sum += $4} END {print sum}'
Gauge

gauges: - title: Minute progress rate-ms: 500 # sampling rate, default = 1000 scale: 2 # number of digits after sample decimal point, default = 1 percent-only: false # toggle display of the current value, default = false color: 178 # 8-bit color number, default one is chosen from a pre-defined palette cur: sample: date +%S # sample script for current value max: sample: echo 60 # sample script for max value min: sample: echo 0 # sample script for min value - title: Year progress cur: sample: date +%j max: sample: echo 365 min: sample: echo 0
Textbox

textboxes: - title: Local weather rate-ms: 10000 # sampling rate, default = 1000 sample: curl wttr.in?0ATQF border: false # border around the item, default = true color: 178 # 8-bit color number, default is white - title: Docker containers stats rate-ms: 500 sample: docker stats --no-stream --format "table {{.Name}}\t{{.CPUPerc}}\t{{.MemUsage}}\t{{.PIDs}}"
Asciibox

asciiboxes: - title: UTC time rate-ms: 500 # sampling rate, default = 1000 font: 3d # font type, default = 2d border: false # border around the item, default = true color: 43 # 8-bit color number, default is white sample: env TZ=UTC date +%r
5、额外功能
Triggers
触发器允许执行条件操作,如视觉/声音告警或任意shell命令。以下示例说明了此概念。
Clock gauge,从开始的每分钟显示时间进度和当前时间
gauges: - title: MINUTE PROGRESS position: [[0, 18], [80, 0]] cur: sample: date +%S max: sample: echo 60 min: sample: echo 0 triggers: - title: CLOCK BELL EVERY MINUTE condition: '[ $label == "cur" ] && [ $cur -eq 0 ] && echo 1 || echo 0' # expects "1" as TRUE indicator actions: terminal-bell: true # standard terminal bell, default = false sound: true # NASA quindar tone, default = false visual: false # notification with current value on top of the component area, default = false script: say -v samantha `date +%I:%M%p` # an arbitrary script, which can use $cur, $prev and $label variables
搜索引擎延迟图表,在延迟超过阈值时向用户发出告警
runcharts: - title: SEARCH ENGINE RESPONSE TIME (sec) rate-ms: 200 items: - label: GOOGLE sample: curl -o /dev/null -s -w '%{time_total}' https://www.google.com - label: YAHOO sample: curl -o /dev/null -s -w '%{time_total}' https://search.yahoo.com triggers: - title: Latency threshold exceeded condition: echo "$prev < 0.3 && $cur > 0.3" |bc -l # expects "1" as TRUE indicator actions: terminal-bell: true # standard terminal bell, default = false sound: true # NASA quindar tone, default = false visual: true # visual notification on top of the component area, default = false script: 'say alert: ${label} latency exceeded ${cur} second' # an arbitrary script, which can use $cur, $prev and $label variables
交互式 shell 支持
除了sample命令之外,还可以指定init命令(在采样前仅执行一次)和transform命令(后处理采样命令输出)。这包括交互式shell用例,例如仅建立与数据库的连接一次,然后在交互式shell会话中执行轮询。
Basic mode
textboxes: - title: MongoDB polling rate-ms: 500 init: mongo --quiet --host=localhost test # executes only once to start the interactive session sample: Date.now(); # executes with a required rate, in scope of the interactive session transform: echo result = $sample # executes in scope of local session, $sample variable is available for transformation
PTY mode
在某些情况下,交互式shell将无法工作,因为它的stdin不是终端。这种情况下我们可以使用PTY模式:
textboxes: - title: Neo4j polling pty: true # enables pseudo-terminal mode, default = false init: cypher-shell -u neo4j -p pwd --format plain sample: RETURN rand(); transform: echo "$sample" | tail -n 1 - title: Top on a remote server pty: true # enables pseudo-terminal mode, default = false init: ssh -i ~/user.pem ec2-user@1.2.3.4 sample: top
init 命令逐步执行
在开始采样之前,还可以逐个执行多个init命令。
textboxes: - title: Java application uptime multistep-init: - java -jar jmxterm-1.0.0-uber.jar - open host:port # or local PID - bean java.lang:type=Runtime sample: get Uptime
变量
如果配置文件包含重复的模式,则可以将它们提取到变量部分。此外,还可以在启动时使用-v/–variable标志指定变量,并且任意的系统环境变量也可以在脚本中使用。
variables: mongoconnection: mongo --quiet --host=localhost testbarcharts: - title: MongoDB documents by status items: - label: IN_PROGRESS init: $mongoconnection sample: db.getCollection('events').find({status:'IN_PROGRESS'}).count() - label: SUCCESS init: $mongoconnection sample: db.getCollection('events').find({status:'SUCCESS'}).count() - label: FAIL init: $mongoconnection sample: db.getCollection('events').find({status:'FAIL'}).count()
颜色主题

theme: light # default = darksparklines: - title: CPU usage sample: ps -A -o %cpu | awk '{s+=$1} END {print s}'
6、真实场景
数据库
以下是不同的数据库连接示例。建议使用交互式shell(init脚本)仅建立一次连接,然后在采样期间重用即可。
MySQL
# prerequisite: installed mysql shellvariables: mysql_connection: mysql -u root -s --database mysql --skip-column-namessparklines: - title: MySQL (random number example) pty: true init: $mysql_connection sample: select rand();
PostgreSQL
# prerequisite: installed psql shellvariables: PGPASSWORD: pwd postgres_connection: psql -h localhost -U postgres --no-align --tuples-onlysparklines: - title: PostgreSQL (random number example) init: $postgres_connection sample: select random();
MongoDB
# prerequisite: installed mongo shellvariables: mongo_connection: mongo --quiet --host=localhost testsparklines: - title: MongoDB (random number example) init: $mongo_connection sample: Math.random();
Neo4j
# prerequisite: installed cypher shellvariables: neo4j_connection: cypher-shell -u neo4j -p pwd --format plainsparklines: - title: Neo4j (random number example) pty: true init: $neo4j_connection sample: RETURN rand(); transform: echo "$sample" | tail -n 1
Kafka
检查kafka lag值,计算每个队列lag值的和,高于阈值报警,多consumergroup,多topic。
variables: kafka_connection: $KAFKA_HOME/bin/kafka-consumer-groups --bootstrap-server localhost:9092runcharts: - title: Kafka lag per consumer group rate-ms: 5000 scale: 0 items: - label: A->B sample: $kafka_connection --group group_a --describe | awk 'NR>1 {sum += $5} END {print sum}' - label: B->C sample: $kafka_connection --group group_b --describe | awk 'NR>1 {sum += $5} END {print sum}' - label: C->D sample: $kafka_connection --group group_c --describe | awk 'NR>1 {sum += $5} END {print sum}'
Docker
Docker容器统计信息(CPU,MEM,O/I)
textboxes: - title: Docker containers stats sample: docker stats --no-stream --format "table {{.Name}}\t{{.CPUPerc}}\t{{.MemPerc}}\t{{.MemUsage}}\t{{.NetIO}}\t{{.BlockIO}}\t{{.PIDs}}"
SSH
远程服务器上的TOP命令
variables: sshconnection: ssh -i ~/my-key-pair.pem ec2-user@1.2.3.4textboxes: - title: SSH pty: true init: $sshconnection sample: top
JMX
Java应用程序的正常运行示例
# prerequisite: download [jmxterm jar file](https://docs.cyclopsgroup.org/jmxterm)textboxes: - title: Java application uptime multistep-init: - java -jar jmxterm-1.0.0-uber.jar - open host:port # or local PID - bean java.lang:type=Runtime sample: get Uptime transform: echo $sample | tr -dc '0-9' | awk '{printf "%.1f min", $1/1000/60}'
本公众号全部博文已整理成一个目录,请在公众号后台回复「m」获取!
推荐阅读:
1、 超详细!一文带你了解 LVS 负载均衡集群!
2、 手把手带你搭建 Elasticsearch 集群
3、 集群磁盘故障,如何在服务器上挂载大于 2T 的磁盘?
4、 一文详解 LVS、Nginx 及 HAProxy 工作原理【附大图】
5、 Nginx系列教程(一)| 手把手教你在Linux环境下搭建Nginx服务
6、 Nginx系列教程(二)| 一文带你读懂Nginx的正向与反向代理
7、 Nginx系列教程(三)| 一文带你读懂Nginx的负载均衡
8、 Nginx系列教程(四)| 一文带你读懂Nginx的动静分离
9、 Nginx系列教程(五)| 利用 Nginx+Keepalived 实现高可用技术
10、 Nginx系列教程(六)| 手把手教你搭建 LNMP 架构并部署天空网络电影系统
关注微信公众号「 杰哥的IT之旅」,后台回复「 1024」查看更多内容,回复「 加群」 备注:地区-职业方向-昵称 即可加入读者交流群。
==============================================================================================================================================================================================================================================================================================================================================================================================================================================================================================================================================================================================================================================================================================================================================================================================================================================================================================================================================================================================================================================================================================================================================================================================================================================================================================================================================================================================================================================================================================================================================================================================================================================================================================================================================================================================================================================================================================================================================================================================================================================================================================================================================================================================================================================================================================================================================================================================================================================================================================================================================================================================================================================================================================================================

点个[在看],是对杰哥最大的支持!
本文分享自微信公众号 - 杰哥的IT之旅(Jake_Internet)。
如有侵权,请联系 support@oschina.cn 删除。
本文参与“OSC源创计划”,欢迎正在阅读的你也加入,一起分享。