用请求量和 P95 定位慢接口
本节目录
如果两条接口的 P95 分别是 2,500 ms 和 800 ms,该先查哪条?还要看看各有多少请求、耗时样本覆盖多少,以及超出业务阈值的请求有几条。本节用同一份合成日志把这些数字放在一起。 回顾按接口排查 5xx
hwlog 0.1.0 的发布包含源码、wheel、README 和合成样例。 GitHub 源码 · v0.1.0 Release · 下载完整 ZIP
把 P95 和受影响的请求放在一起看
继续用最邻近秩法。将每个接口的有效耗时排序,取第 ceil(0.95 × n) 位。它表示在这组样本里,至少 95% 的观测值不超过这个位置的值。样本很少时尤其要同时看数量。两条请求的 P95 会取第 2 位,也就是较慢的那一条。
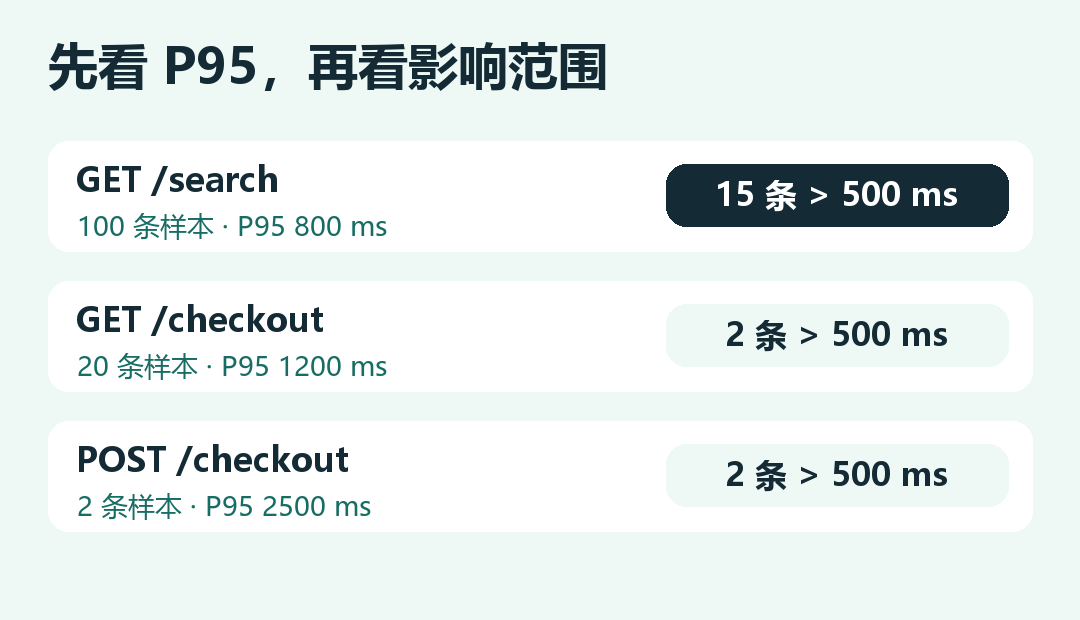
我们把耗时 大于 500 ms 记为慢请求,恰好 500 ms 仍在阈值内。筛选时用 --slow-ms 调整门槛。以下样例假定这些接口先用同一个门槛做排查,实际服务可以采用各自的延迟目标。
准备样例和脚本
在 0.1.0 发布包 中使用 examples/latency.jsonl。以下三条摘自这个文件,其中一条请求没有耗时。
{"ts":"2026-11-19T09:00:00+00:00","method":"GET","path":"/search","status":200,"duration_ms":120}
{"ts":"2026-11-19T09:01:25+00:00","method":"GET","path":"/search","status":200,"duration_ms":800}
{"ts":"2026-11-19T09:00:11+00:00","method":"GET","path":"/catalog","status":200}
将代码保存为 slow_paths.py,或直接使用包里的 examples/slow_paths.py。和上一节一样,先在虚拟环境里安装 hwlog。
import argparse
import math
from collections import Counter, defaultdict

from hwlog.log_cli import build_parser, parse_args, selected_rows
from hwlog.metrics import percentile_95


def nonnegative_ms(text):
    try:
        value = float(text)
    except ValueError as error:
        raise argparse.ArgumentTypeError("请传入有限且非负的毫秒数") from error
    if not math.isfinite(value) or value < 0:
        raise argparse.ArgumentTypeError("请传入有限且非负的毫秒数")
    return value


def summarize(lines, args):
    counts = Counter()
    durations = defaultdict(list)
    skipped = Counter()
    for request in selected_rows(lines, args, skipped):
        endpoint = (request.method, request.path)
        counts[endpoint] += 1
        if request.duration_ms is not None:
            durations[endpoint].append(request.duration_ms)

    groups = []
    for endpoint, total in counts.items():
        samples = durations[endpoint]
        slow = sum(duration > args.slow_ms for duration in samples)
        groups.append((endpoint, total, len(samples), percentile_95(samples), slow))
    groups.sort(key=lambda group: (-group[4], -group[2], group[0]))
    return groups, skipped


def main(argv=None):
    parser = build_parser("按请求分组统计 P95 和超阈值次数")
    parser.add_argument("--slow-ms", type=nonnegative_ms, default=500.0, help="慢请求的毫秒阈值")
    args = parse_args(parser, argv)
    try:
        with args.input.open(encoding="utf-8") as log:
            groups, skipped = summarize(log, args)
    except (OSError, UnicodeError) as error:
        parser.error(f"无法读取输入:{error}")

    print(f"慢请求阈值:>{args.slow_ms:g} ms;整份输入跳过:{sum(skipped.values())}")
    for (method, path), total, samples, p95, slow in groups:
        p95_text = f"{p95:g} ms" if p95 is not None else "无样本"
        slow_text = str(slow) if samples else "无样本"
        print(f"{method} {path}|请求 {total}|耗时样本 {samples}|P95 {p95_text}|慢请求 {slow_text}")


if __name__ == "__main__":
    main()
python examples/slow_paths.py examples/latency.jsonl --slow-ms 500
慢请求阈值:>500 ms;整份输入跳过:0
GET /search|请求 100|耗时样本 100|P95 800 ms|慢请求 15
GET /checkout|请求 20|耗时样本 20|P95 1200 ms|慢请求 2
POST /checkout|请求 2|耗时样本 2|P95 2500 ms|慢请求 2
GET /health|请求 200|耗时样本 200|P95 15 ms|慢请求 0
GET /catalog|请求 12|耗时样本 0|P95 无样本|慢请求 无样本
先查影响范围,再查极慢的请求
如果目标是先减少受影响的请求数,我会优先看 GET /search。它有 15 条超阈值请求,虽然 P95 低于两个结账分组。这个例子里搜索接口的平均耗时只有 222 ms,因此只看平均值会漏掉这批 800 ms 的请求。POST /checkout 的两条请求都很慢,如果它是关键交易路径,仍应单独跟进。另有 12 条 GET /catalog 缺少耗时,需先核对采集字段才能评价延迟。
练习把阈值改成 --slow-ms 1000。搜索接口的超阈值次数应降为 0,GET 和 POST 的结账分组应各有 2 条。再比较两次报表的 P95:阈值只影响「慢请求」计数,各组的 P95 应保持一致。 继续整理和发布工具